

Natural Gas, Doji, Moving Averages, Rising Wedge – Technical Update:
- Natural gas prices climbed for a second consecutive week
- Upside follow-through after a Doji on the weekly in focus
- The 50-day Simple Moving Average is holding as resistance
Trade Smarter – Sign up for the DailyFX Newsletter
Receive timely and compelling market commentary from the DailyFX team
Subscribe to Newsletter
Weekly Chart – Follow-Through After a Doji?
Natural gas prices aimed slightly higher for the second week in a row. This followed the emergence of positive RSI divergence on the weekly chart. The latter is a sign of fading downside momentum, which can at times precede a turn higher. A Doji candlestick pattern also emerged earlier in April, further adding to the argument that the dominant downtrend since last year is running out of steam. Last week’s upside follow-through after the Doji could open the door to extending gains, placing the focus on the 2.422 inflection zone. Beyond that sits the 20-week Simple Moving Average (SMA).
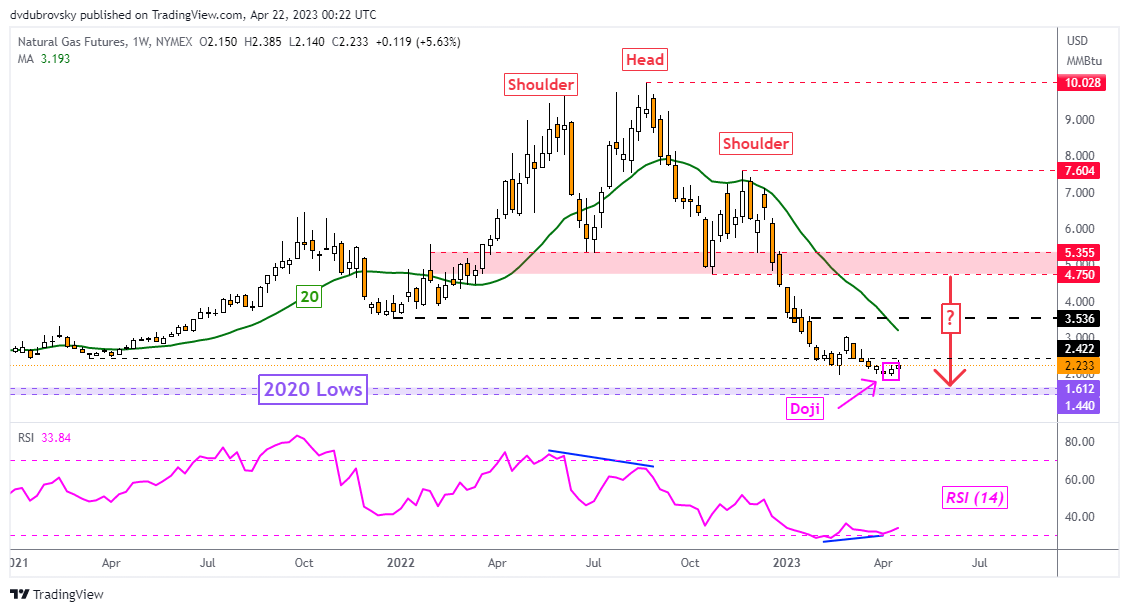
Chart Created Using TradingView
Daily Chart – Eyes on the 50-Day SMA
The daily chart helps reveal the key obstacle natural gas prices face in the week ahead that could stall efforts to push higher. That is namely the 50-day SMA, which held as key resistance last week, maintaining the dominant downside focus. This is offering a near-term neutral outlook given that prices have been unable to find directional momentum since falling back to the February low at 1.967. Closing above the 50-day SMA could offer an increasingly bullish outlook, exposing the March high at 3.027. Otherwise, falling under support exposes the 2020 bottom at 1.44.
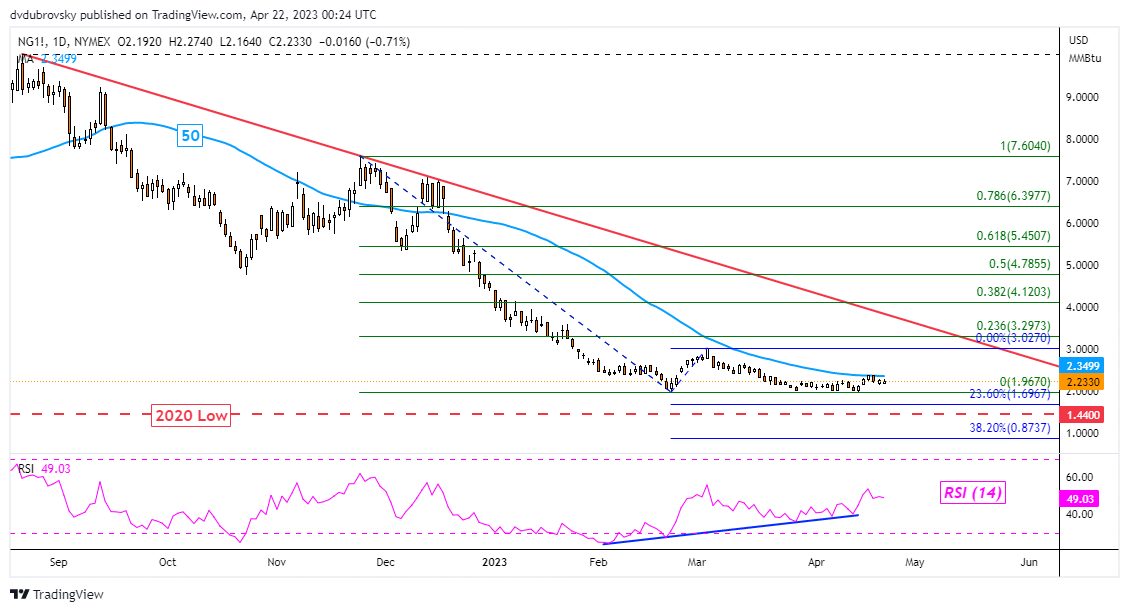
Chart Created Using TradingView
4-Hour Chart – Rising Wedge and 100-Period SMA
The 4-hour chart can give a better near-term picture of what the heating commodity could face in the week ahead. Last week, prices confirmed a breakout under a Rising Wedge chart formation, opening the door to extending losses. But, natural gas was unable to clear under the 100-period SMA, which reinforced it as key support. Prices are idling around the ceiling of a former rectangle chart pattern at 2.238. Clearing this resistance exposes the 61.8% Fibonacci retracement level at 2.373. Otherwise, falling under the 100-period SMA may open the door to revisiting the February low.
Recommended by Daniel Dubrovsky
The Fundamentals of Breakout Trading
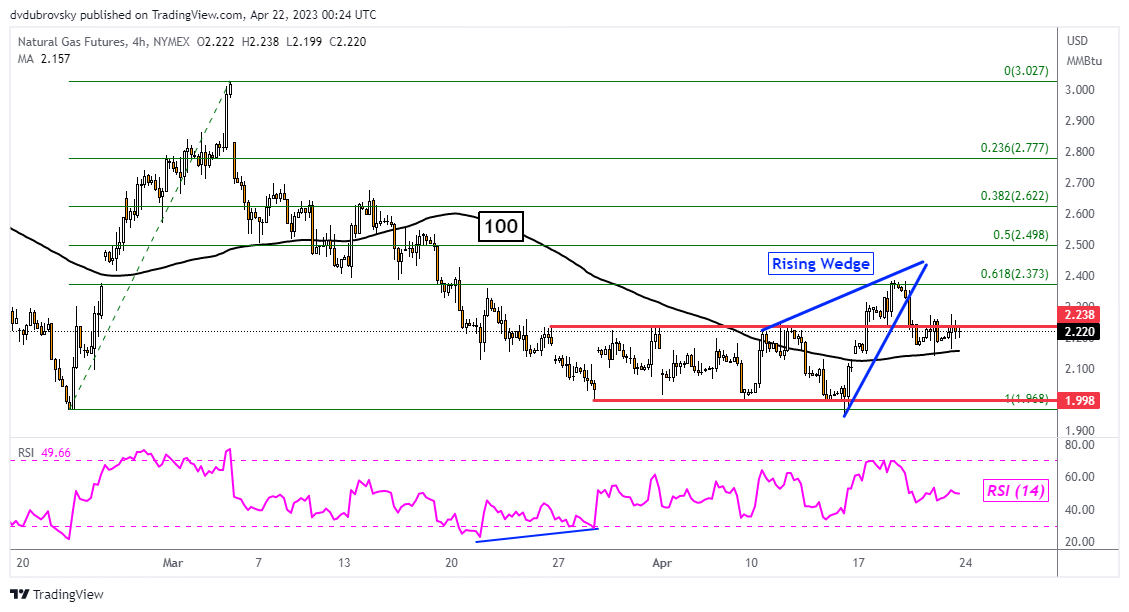
Chart Created Using TradingView
— Written by Daniel Dubrovsky, Senior Strategist for DailyFX.com
To contact Daniel, follow him on Twitter:@ddubrovskyFX
Comments are closed.