
- The Dow Jones Industrial Index falls on Thursday but outperforms NASDAQ, S&P 500.
- Federal Reserve dot plot raises interest rate forecasts for 2024, 2025.
- Cisco attempts to buy Splunk for $28 billion.
- Powell says majority of Fed governors favor another hike in 2023.
- Initial Jobless Claims of 201K came in well below consensus.
The Dow Jones Industrial Average (DJIA) is down 0.44% on Thursday morning, at the time of writing a half hour into the session, as the entire equity market recedes for a second day after the Federal Reserve press conference on Wednesday. The US central bank once again paused interest rates but raised the specter of another hike before next year. Thursday looks even worse for the Dow as its futures pull back 0.6% in the premarket.
Dow component Cisco (CSCO) announced plans to buy Splunk (SPLK) for $28 billion. The deal values Splunk at a 32% premium to Wednesday’s closing price. On the other hand, Cisco’s share price fell nearly 5% on the news.
The more value-oriented Dow has so far been outperforming its index cousins this week. The NASDAQ Composite and S&P 500 have both fallen by more than 1% on Thursday.
Dow Jones News: Fed delivers most hawkish pause possible
As predicted far and wide, the Federal Reserve left interest rates parked in the range of 5.25% to 5.5%. The Dow Jones advanced in the lead up to Wednesday’s Federal Open Market Committee presser, but the entire market caved once it saw the Fed’s dot plot.
The dot plot is just the colloquial term for the Summary of Economic Projections (SEP) report that shows individual Fed governors’ forecasts for interest rates in the future. A big surprise was that about two-thirds of voting governors think the bank will raise rates again before the year is out. In total, 12 governors estimated that 2023 ends 25 basis points higher than the current range, while seven governors forecast rates staying put.
Still, the CME Group’s FedWatch Tool has only ticked up from 29% to a 31.5% chance that the central bank raises rates at the November 1 meeting. The forecast for a 25 bps hike at the December 31 meeting likewise has only risen by 2 percentage points to 39%.
The market seems less focused on 2023 rates and more worried that the Fed thinks rates will remain higher for longer. In the previous meeting, the dot plot showed consensus among governors for interest rates falling by 100 basis points by the end of 2024. The September version, however, showed a mere 50 basis point cut. What’s more, the new SEP has rates coming down more slowly in 2025 than earlier projections.
This new hawkish demeanor from the Fed’s Powell comes on the back of higher-than-expected Consumer Price Index (CPI) and Producer Price Index (PPI) data that showed an inflationary environment more stubborn than before.
Essentially, the equity market is in decline as institutional investors bail out of stocks for the greater certainty of Treasuries. The 2-year Treasury saw yields rise nearly 2% early Thursday to a level not seen in decades. If there is any silver lining, it is that the more growth-oriented NASDAQ is beginning to underperform the less interest rate-sensitive Dow Jones index.
Initial Jobless Claims arrive lower than consensus
The Initial Jobless Claims for the week ending September 15 were reported before market open on Thursday. The topline figure of 201K was well below consensus of 225K, as well as the previous week’s print of 221K. It seems the economy, and the labor market is doing better than economists expected.
Continuing Jobless Claims for the week ending September 8 also performed better than the average forecast. Continuing Jobless Claims printed at 1.662 million, lower than the previous report for 1.683 million.
After the market opens, data on US Existing Home Sales Change for August will be released. The consensus expects an improving picture after the previous month’s -2.2% print.
On Friday, the S&P Global PMIs for Manufacturing and Services will be released. Both are expected to improve by 10 basis points to 48 and 50.6, respectively.
Interest rates FAQs
Interest rates are charged by financial institutions on loans to borrowers and are paid as interest to savers and depositors. They are influenced by base lending rates, which are set by central banks in response to changes in the economy. Central banks normally have a mandate to ensure price stability, which in most cases means targeting a core inflation rate of around 2%.
If inflation falls below target the central bank may cut base lending rates, with a view to stimulating lending and boosting the economy. If inflation rises substantially above 2% it normally results in the central bank raising base lending rates in an attempt to lower inflation.
Higher interest rates generally help strengthen a country’s currency as they make it a more attractive place for global investors to park their money.
Higher interest rates overall weigh on the price of Gold because they increase the opportunity cost of holding Gold instead of investing in an interest-bearing asset or placing cash in the bank.
If interest rates are high that usually pushes up the price of the US Dollar (USD), and since Gold is priced in Dollars, this has the effect of lowering the price of Gold.
The Fed funds rate is the overnight rate at which US banks lend to each other. It is the oft-quoted headline rate set by the Federal Reserve at its FOMC meetings. It is set as a range, for example 4.75%-5.00%, though the upper limit (in that case 5.00%) is the quoted figure.
Market expectations for future Fed funds rate are tracked by the CME FedWatch tool, which shapes how many financial markets behave in anticipation of future Federal Reserve monetary policy decisions.
Dow Jones Industrial Average forecast
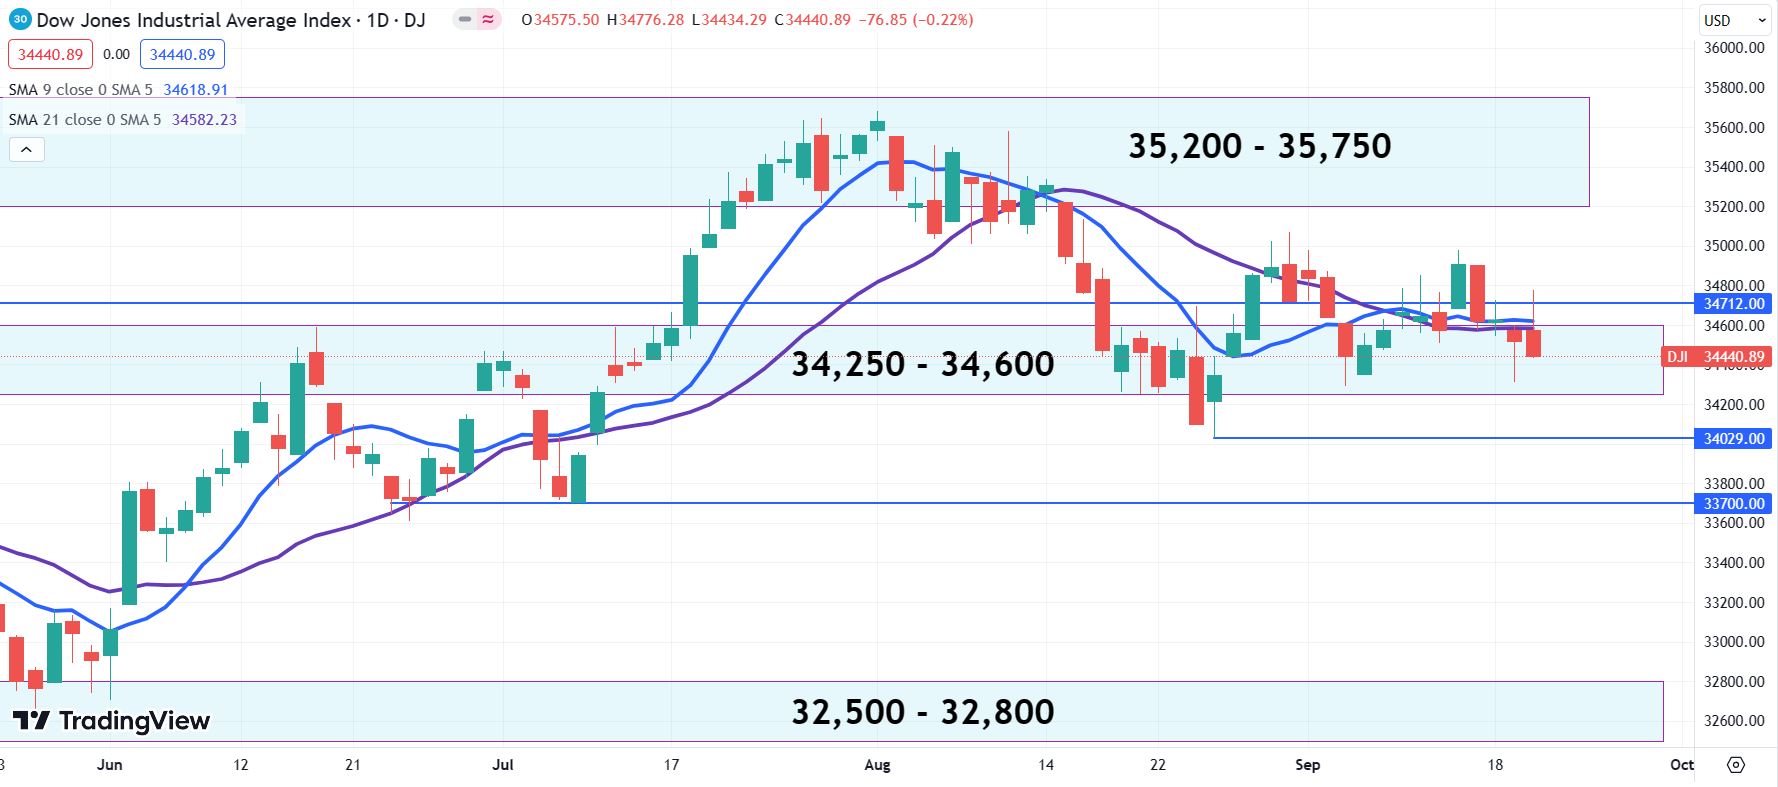
The Dow Jones appears to be in pullback mode. The index has not reached a new high since August 1, nearly two months ago. The futures market shows the Dow crossing below the 32,291 low from September 6. With the DJIA now plumbing the line near 34,250, the next stop may be the August 25 low at 34,029. A true downtrend will need to break to a lower low below that 34,029 level, however. That is why 33,700 seems like a solid bet at the moment.

Dow Jones Industrial Average daily chart
It does appear that investors should have foreseen the current pullback. Dow Theory tells us that we should watch out for periods where the Dow Jones Industrial Average pulls away from the Dow Transport Index (DJT), and that is exactly what took place mid-summer. In the chart below, the DJT advanced well above the DJIA, which it normally travels with in near lock-step.
Dow Theory says that when this relationship gets out of whack, a reversal in trend is likely to come next. Sure enough, that seems to be taking place right in front of use.
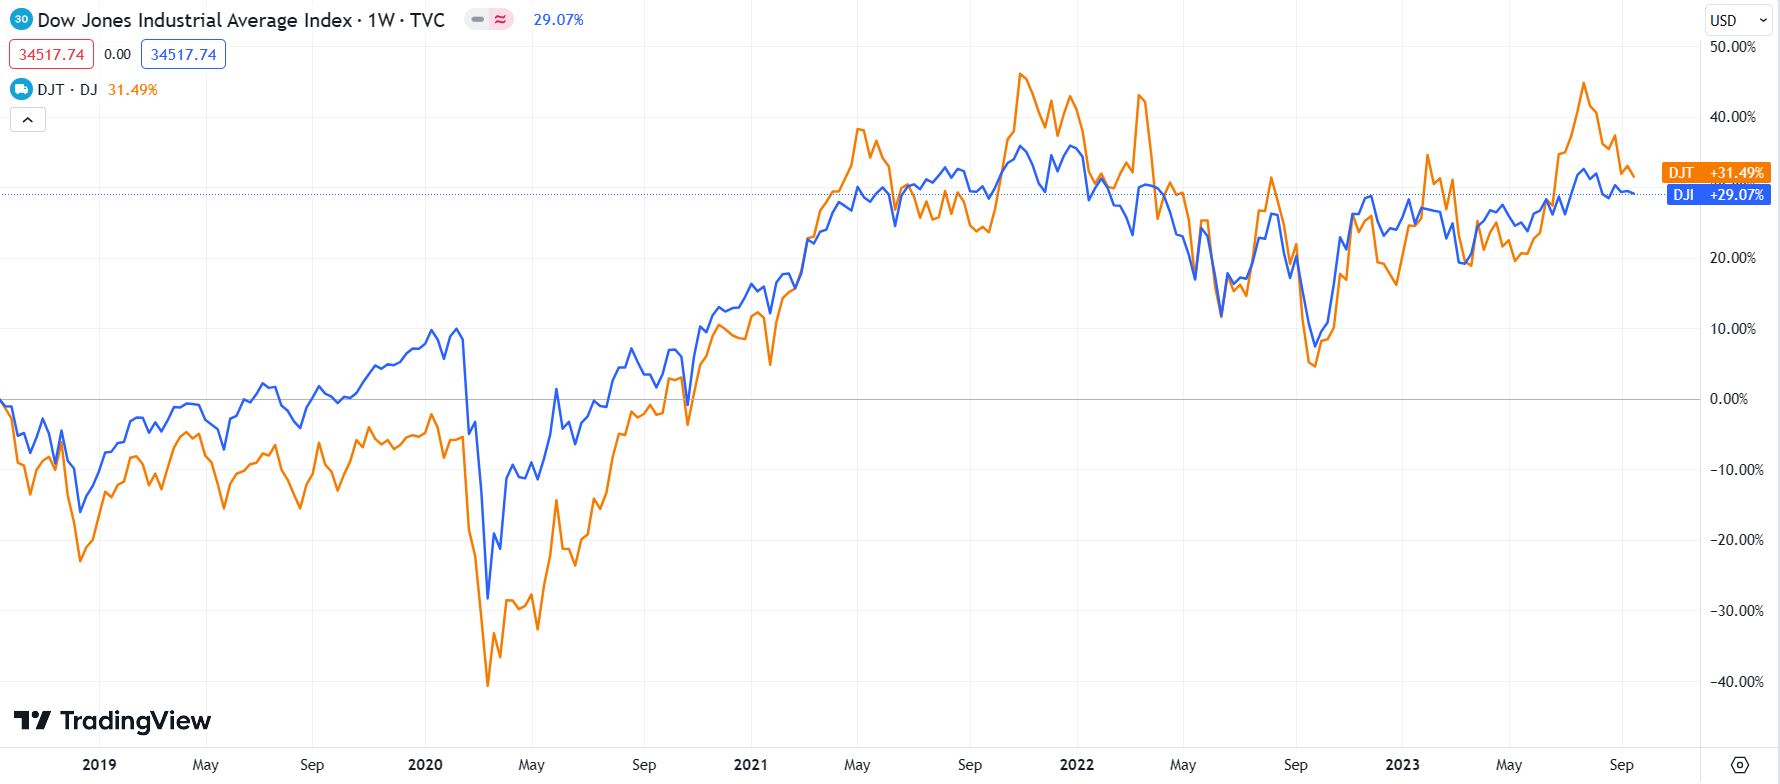
DJT/DJIA 5-year chart
Comments are closed.