

Short Term Elliott Wave View in DAX suggests the rally from 3.20.2023 low is in progress as a 5 waves impulse. Up from 3.20.2023 low, wave 1 ended at 15298.49 and pullback in wave 2 ended at 14809.82. Index then extends higher in wave 3 towards 16331.94. Pullback in wave 4 is unfolding as a zigzag Elliott Wave structure. Down from wave 3, wave ((a)) ended at 15726.5 and wave ((b)) ended at 16079.73. Wave ((c)) lower ended at 15629.12 which completed wave 4. Index has resumed higher in wave 5.
Dax 1 Hour Elliott Wave chart
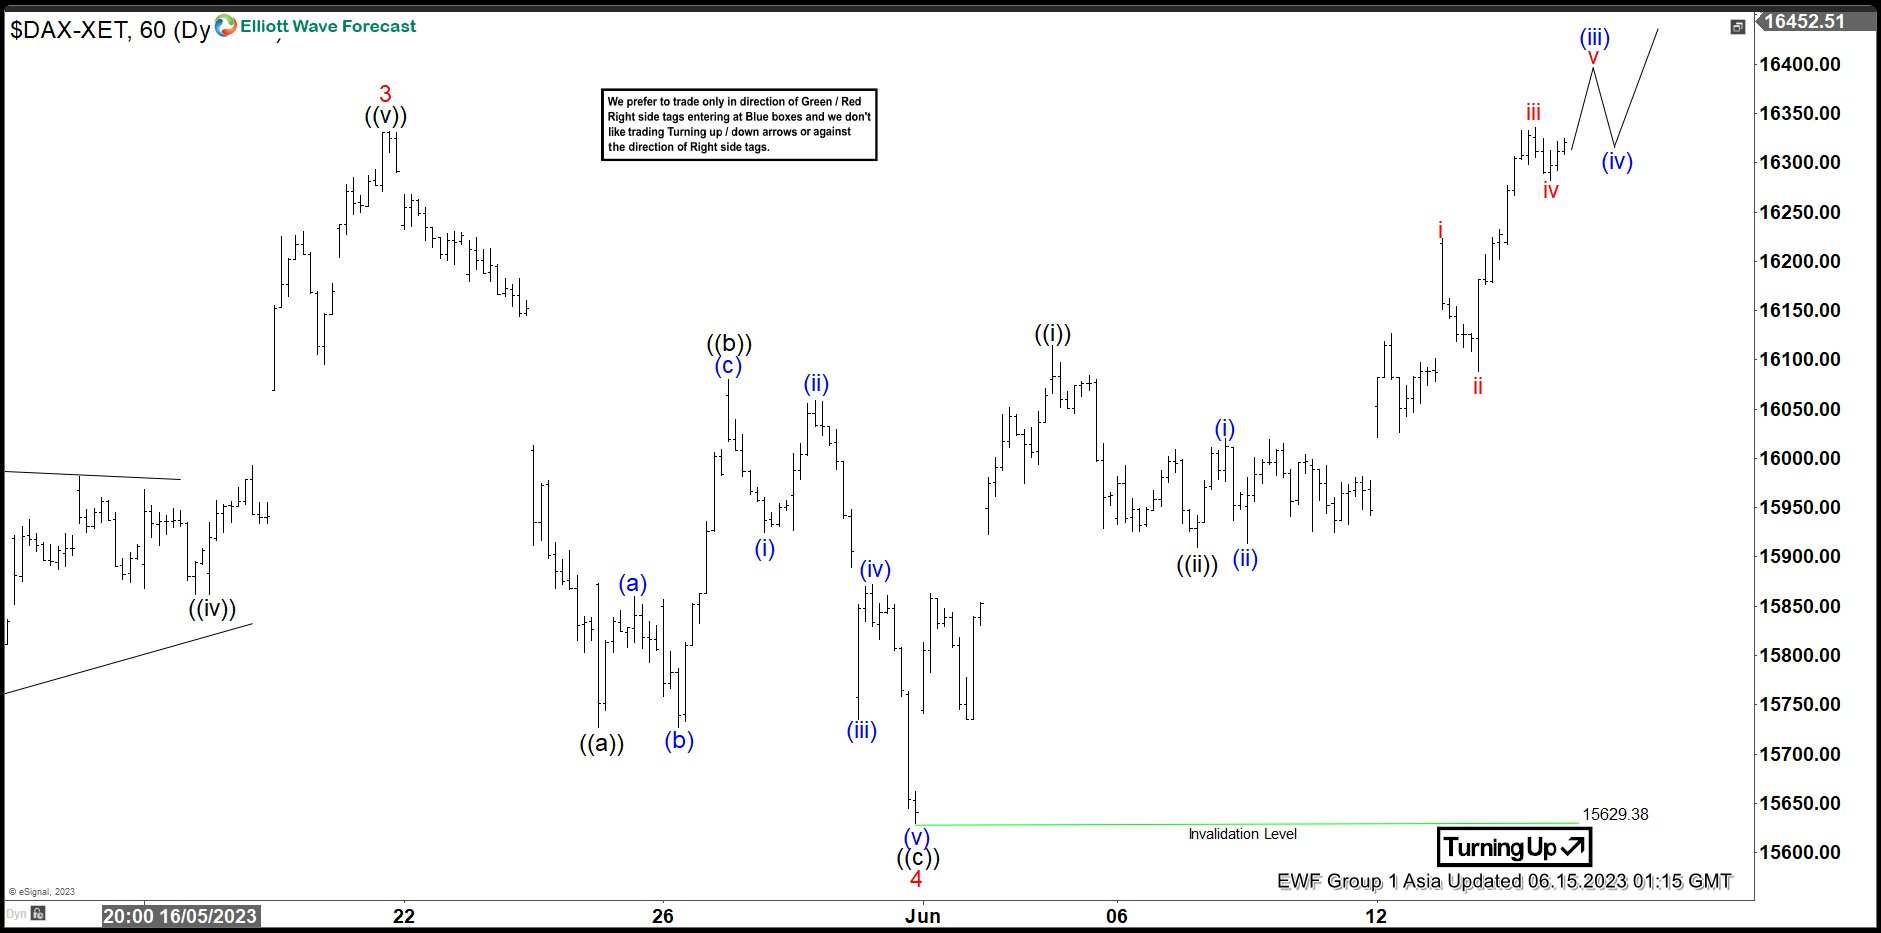
Internal subdivision of wave 5 is unfolding as a 5 waves impulse Elliott Wave structure. Up from wave 4, wave ((i)) ended at 16114.84 and pullback in wave ((ii)) ended at 15909.85. Index then resumes higher again in wave ((iii)). Up from wave ((ii)), wave (i) ended at 16020.28 and wave (ii) ended at 15913.95. Expect the Index to extend higher 1 more leg to complete wave (iii), then it should pullback in wave (iv) before it resumes higher again. Near term, as far as pivot at 15629.38 low stays intact, expect dips to find support in 3, 7, or 11 swing for further upside.
Dax Elliott Wave video
Comments are closed.