DAX, FTSE Prices Muted in Narrow Range of Technical Support and Resistance
FTSE 100, DAX 40 Technical Outlook
Recommended by Tammy Da Costa
Get Your Free Top Trading Opportunities Forecast
Dax futures have recently struggled to maintain the bullish momentum responsible driving the major European index above 15,000. While the FTSE 100 experienced a pullback from its highest level since 2018, Dow futures have continued to threaten resistance.
As a weaker US Dollar and rate expectations drive the global equities, rising volatility, sentiment and technical levels could provide an additional catalyst for price action.
With fundamentals largely priced in, the below charts illustrate the manner in which historical moves could continue to assist in guiding prices.
Recommended by Tammy Da Costa
Get Your Free Equities Forecast
DAX 40 Technical Analysis
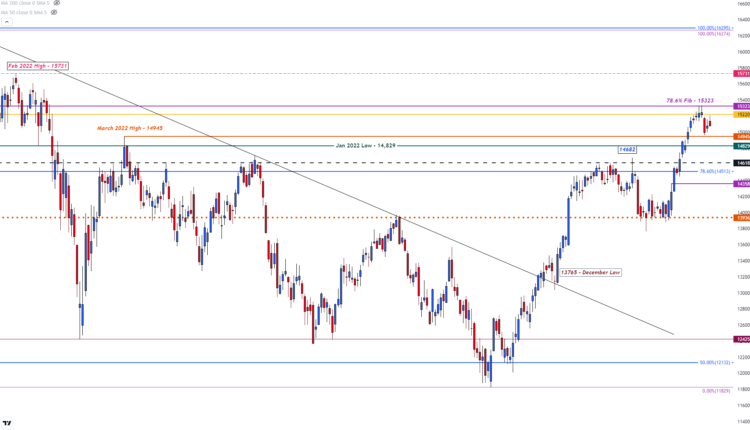
For the German Dax, the 78.6% Fibonacci retracement from the 2022 that limited gains throughout last year has remained as key resistance. Although the same levels discussed last week currently remain intact, prices have fallen into a zone of confluency that could influence both the short and longer-term move.
After reaching a high of 15,332 last Tuesday on the 17th of Jan, failure to gain traction above this level forced Dax futures lower. However, with the psychological level of 15,000 forming as support, a temporary retest of 14,961 was met with swift retaliation from bulls.
Taking a closer look at today’s price action, the current daily range between 15,071 and 15,209 has resulted in lackluster momentum.
Dax 40 Daily Chart
Chart prepared by Tammy Da Costa using TradingView
German Dax Price Levels
| Support | Resistance |
|---|---|
| S1: 15,000 | R1: 15,200 |
| S2: 14,945 | R2: 15,323 |
| S3: 14,829 (Jan 2022 Low) | R3: 15,400 |
Recommended by Tammy Da Costa
The Fundamentals of Range Trading
UK FTSE 100 Technical Analysis
With the FTSE 100 trading marginally higher, materials and consumer staples have gained 0.64% and 0.58% respectively while utilities lead losses with a 1.00% decline.

Source: Refinitiv
FTSE 100 Daily Chart
Chart prepared by Tammy Da Costa using TradingView
FTSE 100 Price Levels
| Support | Resistance |
|---|---|
| S1: 7,726 (last week’s low) | R1: 7,790 |
| S2: 7,689 (Jan 2020 High) | R2: 7,830 |
| S3: 7,600 | R3: 7,875 (Jan high) |
— Written by Tammy Da Costa, Analyst for DailyFX.com
Contact and follow Tammy on Twitter: @Tams707


Comments are closed.