

INTRODUCTION
There are some significant new features in version 2.1 of CoralMAX, more than I can adequately describe in the change log. So this post will be a deep-dive on what's new.
CoralMAX is an EA for position trading. It is available in the MQL5 Market (here), and there is a blog post that covers its functionality, features and options (here). Strategies, test results and settings files are available on their own blog post (here).
BUG FIXES
First, a list bugs fixed:
- Max Orders in Hedging Mode – When Hedged Baskets is enabled the “Max Orders” was counting total orders rather than the orders in one direction. E.g. if you had a maximum number of orders set to 5 and you were in 5 trades short it would not take any trades long. Now it will count the number for each direction, so if the max orders is set to 5 with hedging mode turned on, then you can have up to 5 long and up to 5 short at the same time.
- Title bar – The title bar was meant to be showing both the magic number and trade comment. This had been missing from the original release.
POWER ON SELF TEST
I remember as a kid playing arcade games, those big cabinets with the screen and controls built-in. My jam was “Joust.” When you'd plug it in they'd start up with this impressive “Whoosh!” sound, and the screen would display a bunch of startup information, including something called a “Power On Self Test” or POST. Later I became familiar with these as part of BIOS and firmware, when I was building my own computers from cheaply assembled parts. Good times.
I get lots of questions from people about why Max doesn't take a trade, or if it's setup correctly. There are so many options, and so many different reasons why something may not be working correctly in your environment. If I can't see it, how can I possibly know what's going on there? Then I got the idea to write my own version of a POST for Max. Now, when Max starts up (when you put it on on a chart), there won't be this grand “Whoosh!” sound, but there will be messages written to the log.
- POST Step 1: First Max will check everything it can detect to see if there's any reason that it might not take trades. If anything fails it is written with a “[POST]” message at the WARN logging level. It is checking:
- Is this account enabled for trading?
- Is this account enabled for trading with EAs?
- Is Auto-Trading turned on in MT4?
- Is Auto-Trading turned on for this EA?
- Are Max entries enabled in the inputs?
- Is the maximum number of orders allowed > 0?
- Are LONG and SHORT entries enabled?
- Is Max running in simulated mode?
- Can we calculate ADR and RSI for this symbol? (I.e., is there data available from MT4 for this symbol?)
- POST Step 2: Next, Max will check all of its settings and print out a human-readable summary of the most important details, at the INFO logging level. It is reporting:
- The timeframe we're on
- The number of orders allowed
- Whether hedging is turned on
- The risk mode (fixed lot size or percent) and related values
- If set, the maximum risk allowed
- If set, the risk % above which a SL is required
- ADR spacing
- If set, the Lot Size Increase method and settings
- If set, the RSI Filter settings
- If set, the ADR Filter settings
- If set, the HTF MA settings
- If set, the HTF Signal settings
- If set, the Target ADR and Target Percent settings
- If set, the Trade DDC settings
For instance:

MANUAL TRADES
The Manual Trades window that we have in MultiMAX has been enabled for use within CoralMAX as well:

This window can be toggled with the keyboard “t” shortcut. There is no button currently on the UI to show/hide the window.
Functionally it operates identically to MultiMAX. Changes to values made in this dialog do not change defaults used by CoralMAX, and will not change the CoralMAX settings. These changes are only for the current manual trade, and are discarded once the trade is taken or the window is closed.
See the MultiMAX blog post (here) for all of the details on how this dialog works.
Why enable this dialog in CoralMAX, when we already have the Orders section that allows taking manual trades? Partly it's because I want to tighten the connection between CoralMAX and MultiMAX. They already share a lot of the same code, they should have similar UI/UX as well (beyond just the table-based layout and color schemes). But in addition, there is functionality that we have available in this dialog that does not already exist in CoralMAX, and this was the easiest way to bring that functionality in. In particular I wanted to be able to see the impact of a possible manual trade on the overall basket, by seeing how this trade would change where the basket average is, and the amount of risk that would be needed to move the basket average to a set distance like 0.5 ADR. So now you can open this dialog, it will be pre-configured to your current risk settings, and you'll see the SL/TP lines on the chart and the basket average line. And just like in MultiMAX these lines can be selected and dragged on the chart to see the impact on risk and lot size in the dialog.
Now, as I improve this dialog for one, the same improvements will be simultaneously available in the other. This is literally the same code, all I had to do was turn it on/off via the keyboard shortcut and make it slightly more dynamic (e.g., the title bar correctly tells you which application it's a part of). All the core functionality transferred to the new environment without issue. Yah reusability!
HEDGING CHANGES
The logic that controls whether the EA can open hedged baskets has been moved into the base code, so the Enabled Hedged Baskets option is now found under CORAL BASE OPTIONS.

Now, when hedging mode is enabled, there are separate rows in the Status window for LONG and SHORT positions (Targets, Basket and Trailing Stops):

The LONG and SHORT positions are, for the most part, operated as independent trades, so it makes sense they have their own status rows. You can modify the Targets for LONG and SHORT positions independently (by dragging their respective lines on the charts), and the targets will be displayed separately in the UI now. The trailing stop, if it is enabled, can be turned on and off for the LONG and SHORT positions independently.
HEDGING DDC
In the Trade DDC section there is now an option for Hedging DDC:

Hedging DDC: Use a percentage of the gains of a position in one direction to perform drawdown control on a position in the other direction.
Trade DDC must be enabled for Hedging DDC to be used, as well as setting a value for the Hedging DDC Percent input. When Max has positions open in both directions (i.e., is hedged), if one of them closes out in profit while the other is in drawdown, then the Hedging DDC logic is applied. Let's say that we're in a EURUSD long and short, and the long position closes out with 0.8% profit while the short position is in drawdown. If we have Hedging DDC Percent set to 50.0, then we will use 50% of the profit from this trade to perform DDC on the short position. Max will find the trade that's a part of the short position that is the farthest from average (i.e., the “worst” trade in the short basket) and will reduce up to the percent amount from the trade we just closed in profit, in this case 0.4%.
If the short position has only one trade, then it will reduce 0.4% from that trade. If there are multiple trades in the short position it will reduce up to 0.4% from the farthest trade in drawdown from the average. If it is less than 0.4% in DD that means the entire trade will be closed. Otherwise it will close the largest partial lots it can without exceeding 0.4%.
Using Hedging DDC is a great way to use profits that are being gained in one direction to help keep positions in drawdown in range, while ensuring that you are still banking profits.
RSI AUTO-LEVEL
This is a very experimental feature. I'm exposing it so others can play with it and see if there's any utility in this idea, but I do not have strong evidence for or against it. It's just an idea.
There are two new inputs in the RSI OPTIONS section for “Auto-Level”:

When the RSI Filter is turned on but Auto-Level is turned off, the RSI Filter works as before. It will use the RSI High and RSI Low values from the inputs to determine the market conditions for entry.
How do we know what the right settings are for RSI High and RSI Low, though? In theory we want there to be a high probability that a trade that is entered above/below these levels will, as directly as possible, reverse and hit our trade targets. We can experiment in the backtester with different values to see if there is some optimum setting, and as we detect changes in results over time we can re-assess these settings. It's trial and error, science and intuition. But I was thinking, what if we could automatically determine the “optimum” high/low values in some automated way?
What I want to know is, at what RSI High value, when price has exceeded that level and reverses, will I be more likely for a trade to reach the trade goal first, before reaching the scaling distance? Which RSI level has the best probability, over time and on average, of working out without needing to scale in? That is the condition we are testing for. RSI High and RSI Low are analyzed independently. The RSI Auto-Level Strike Rate is the percentage of time that a reversal from that RSI level results in a winner, and we're looking for an RSI level that achieves that strike rate.
To do this, we test every RSI level starting from the RSI High in the inputs, up to 90.0. Working backwards, we find a candle on the RSI timeframe (e.g., H1) where RSI exceeded that level, and then on the chart timeframe (e.g., M5) we look forwards from there to see if price reached 0.5 ADR in profit before going 0.5 ADR in drawdown. We record whether it was a winner, and then continue looking back to the previous RSI high value. We go back to 100 times that RSI exceeded the high (or the end of available data, whichever comes first), and return the strike rate from that RSI level. If the strike rate is greater than RSI Auto-Level Strike Rate then that becomes the new RSI High value. If not, we then go up to the next RSI level (in steps of 2.0 at a time) and test again with this new level. The result is that we will pick the lowest RSI level above RSI High at which, in recent history, the strike rate was at least RSI Auto-Level Strike Rate. And then the process is repeated for RSI Low.
This routine is run when the EA is first started, and then again every new day. The RSI levels are constantly adjusting to current market conditions. When it sets new values it prints an INFO message to the log; prints a message to the status bar; and sets the current RSI levels to the hover text of the RSI Value cell in the UI, so you can check at any given time what the current values being used are.
What I would expect to see comparing the fixed RSI levels with the RSI auto-level is fewer entries overall (i.e., the RSI level is higher so we reach it less often); positions having a lower duration with less drawdown, and probably a decrease in overall profits and drawdown. And over time, a lower probability of having to manually manage trades that went against us and needed (aggressive) DDC.
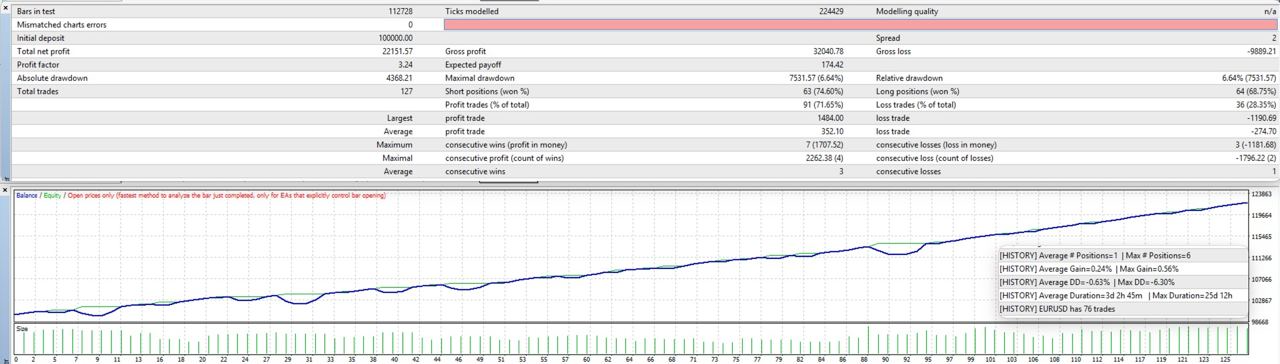
In this test run there were 75 total trades (positions) opened. The average duration was 3 days, with a maximum of 25 days. Average DD was 0.63%, maximum DD seen was 6.3%. On average each position closed out with only a single trade, but on the high-end a maximum of 6 trades was needed.
Compare to the exact same settings, but with RSI Auto-Level turned on:
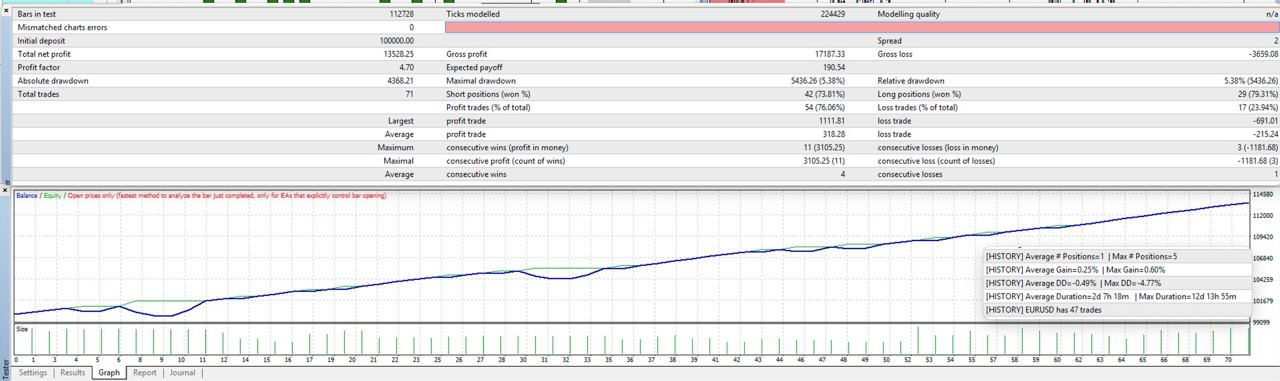
In this case the total number of entries went down (from 76 to 47). The maximum duration went down to just 12 days, with a maximum DD of 4.77%, a reduction of around 1.5%. The maximum number of trades needed was 5, compared to 6 from before. The total profit returned went down as well, from 22.15% to 13.5%. This was expected, but it's disappointing that the effect was so large. However, if this reduces the likelihood of a trading needing some manual intervention, then it could be worth the reduction in gains. It just depends on your comfort level in dealing with trades in drawdown. You can experiment with different values for RSI Auto-Level Strike Rate to find the right balance between strike rate and the returns observed in testing.
This is not a particularly scientific analysis; it is one test, using opening prices only. But it demonstrates that the feature had the intended impact, to reduce drawdown, duration and number of entries from trades.
Comments are closed.