

INTRODUCTION
CoralMAX is an EA for position trading. It is available in the MQL5 Market (here), and there is a blog post that covers its functionality, features and options (here). This blog post will go into more detail of the strategies that CoralMAX uses, including backtest results and set files.
The strategies described here include:
- H1 RSI / M5 Signal
- H4 RSI / M15 Signal
- ADR / M5 Signal
- H1 Hedging (coming soon)
You can also use CoralMAX to give you alerts when these market conditions occur, and you can decide to enter trades manually but then have CoralMAX take over managing the trades. It's a very flexible tool designed specifically for position trading.
I'll start with the back test results. A deeper discussion of position trading and the strategies follows below.
H1 RSI / M5 Signal
Data: EURUSD (2022.01.01 – 2023.06.28)
Mode: Every Tick
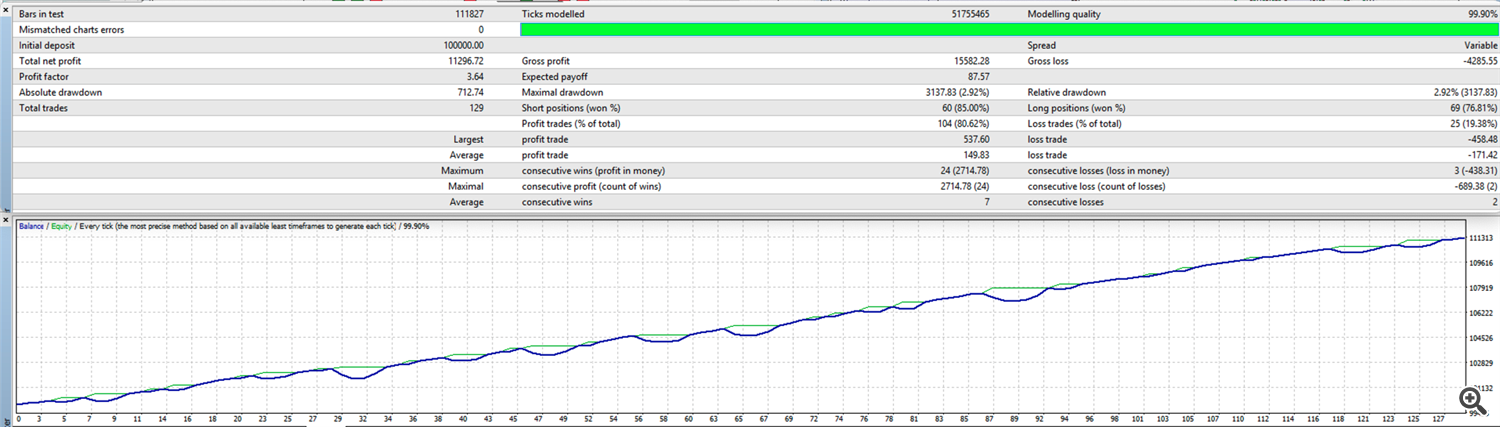
This is a very typical type of growth curve for this strategy. The points where the darker blue profit line dips down while green equity line stays more flat occurs when a position that had multiple trade closes out at a target. The earlier trades in the position may still be in drawdown, but the later trades will be in profit, and the next value of the basket is positive. The the line shows the impact of each individual trade closing, not the net impact of the whole basket closing. Hence we get these little dips. That's a good sign that the strategy is working as intended.
H4 RSI / M15 Signal
Data: EURUSD (2022.01.01 – 2023.06.28)
Mode: Every Tick

ADR / M5 Signal
Data: EURUSD (2022.01.01 – 2023.06.28)
Mode: Every Tick

The ADR / M5 Signal strategy has the same characteristic growth curve as we see with other position trading strategies. We have roughly the same number of entries as the H1 RSI / M5 Signal strategy, but higher profit and higher drawdown.
POSITION TRADING
Position trading is a technique for managing trades. To better understand how position trading works, let's look at the traditional way retail traders trade.
The problem
Retail traders are traditionally taught to try to time their entries to pick the optimal moment to enter, and then to risk 1-3% per trade with a given risk-to-reward ratio of at least 1:1.5 (risk 1x for a 1.5x reward). This means entering a trade with a stop loss some distance away and a take profit 1.5x times the SL distance. If you can be successful in doing this at least 50% of the time then you are a profitable trader.
Most retail traders are not successful. Go to any Forex broker and look at the bottom of their home page, there will be a risk warning, including a statement like the following:
79.43% of retail investor accounts lose money when trading CFDs with this provider.
Why are 80% or more of retail traders failing? Because the flaw in the approach above is to think that the markets can be timed, that we can pick the optimal moment to enter a trade and that the market will cooperate. Some traders obviously can do this successfully and consistently, but that is a very small percentage of retail traders. For most of us mortal traders our psychology gets in the way. We lose a trade, so now we need to win twice as much to reach the day/week/month's goal. We risk a higher percent, or go for a big win, to make up for it. And this more often than not accelerates our losses rather than our gains. But it is not addressing the fundamental problem with the approach, that we cannot time the market with a high enough level of accuracy. When we put a trade in the market with a stop loss, the most likely outcome is that the stop loss will be hit and we will lose the trade. Over and over. The markets are designed to move against us. They are manipulated against us to take our liquidity. The large institutions that actually move the markets know where our liquidity is, and will move the markets just enough to take our money and then make the move without us. They know what we're doing and how to beat us.
The solution
When we are position trading, we are trading without a stop loss, but in a way that does not substantially increase the risk of loss. Instead of trading with 1-3% risk per trade, we are going to trade with a very small amount of risk, 0.05 – 0.25%. If you normally trade 1% risk with a 50 pip SL, then when the trade goes against you by 50 pips, you have lost 1% of your account. If you are trading 0.25% and the trade goes against you, when it is 50 pips in drawdown your are only in 0.25% of drawdown, and your trade BE is 50 pips away. If you were going for a 1.5 R then your TP is now 125 pips away. That is much farther than our original trade idea of 75 pips (50 pips x 1.5 R). So what do we do?
We scale in. We add a second entry to our position. This increases the overall size of the position, but more importantly it moves the position average closer. The BE moves from 50 pips to 25 pips, and the TP moves from 125 pips to 100 pips. And if price continues to move the wrong way, we continue to scale in by adding trades to the position. If we were willing to risk 1%, then the trade can go against us by over 100 pips before reaching this level of drawdown.
Why does this approach work better than traditional stop loss trading? Because it requires less accuracy on our part in terms of when we are entering the trade. We know the market will often move in unpredictable ways designed to rob us of our liquidity (a fancy way of saying they take our money). If we enter a trade when we encounter market conditions that signal to us that price is very likely to reverse from here, but we just don't know when, then we plan our entries small enough to withstand a continuation without experiencing excessive drawdown, while keeping our TP close enough to be reached by the pullback that we know is coming.
Is this martingale, and isn't martingale sure to fail? No, this is not martingale. We are not doubling the lot size in response to losses. We can of course increase the lot size to keep the average from drifting farther and farther away, but that is an advanced technique, and one that is not usually necessary. There are mechanisms in CoralMAX to do this under carefully controlled conditions. For instance, you can ensure that any lot size increases above a level of risk alway use a stop loss; and you can cap the maximum amount of risk % allowed.
Okay, so we're not increasing our lot sizes, but then we're grid trading, right? No, we are not grid trading. For simplicity above I talked about scaling in at a set distance, but in reality we are not scaling in at these fixed distances. Just like when we took our initial entry we were waiting for conditions to occur that signaled a reversal was occurring, we wait for a similar condition before scaling in. If price is moving convincingly against us and has exceeded our scaling distance, we then wait for price action to signal that a reversal may be underway before adding an additional trade to our position. We don't just add trades because we went the scaling distance, we wait for price to tell us it is likely to reverse.
The strategies
Position trading is the technique we use to manage our trades. We know we want to enter a trade (start a new position) when market conditions are favorable to price movement. And we know that we cannot time these entries with a great deal of accuracy, so we get in with smaller risk to give ourselves room to wait for the movement, with a plan for how to handle the situation in cases where the market is too stubborn to reverse. So how do we pick those moments when we want to enter? The strategies implemented in CoralMAX are based on the theory ofreversion to the mean. Most of the time price is ranging, sticking within a range from a high to a low. When you put a moving average on a chart, this is showing you where that average is. There are times when price moves very strongly away from this average, either because of some fundamental economic conditions, a news event, or simple market manipulation. The farther price pulls away from the average, the stronger the impetus for price to pull back towards that average becomes (to revert to the mean). We are looking for ways to detect these moments of strong extension away from the average, and then to enter when price signals that it is reverting. We catch these moves and take small profits from them, as frequently as we can.
The two primary indicators that we use to detect these moments of extension are theRelative Strength Indexand theAverage Daily Range.
HTF Relative Strength Index
In this strategy we are looking at the RSI on a higher timeframe, the H1 chart. For example:

This is the H1 RSI(21) set to an RSI High of 70 and RSI Low of 30. When RSI is above the RSI High we look for opportunities to enter short; and when the RSI is below the RSI Low we look for opportunities to enter long. I've identified a moment when RSI exceeded the RSI High, and drawn two lines to locate this with price on the chart.
Once the market condition has been observed in the HTF chart, we then look for a moment to enter on the LTF chart. For this strategy the HTF chart is H1, where we look for RSI extensions. For entries we use the M5 chart and are looking for an entry signal. The entry signal is break of market structure that indicates that price is changing directions; because we saw an RSI Low on H1, we are looking for a bullish entry signal on the M5. Here is the same moment on the M5 chart, before the signal is triggered:

The green horizontal line extending above current price is the bullish signal line, indicating where price needs to close above to trigger an entry. Because RSI is extended on the H1, when price closes past this line and generates a bullish signal, the EA will enter the trade.

Now that we're in, the trade will either scale in if price goes 0.5 ADR farther down; or will close at target if price moves 0.5 ADR higher.

This is a simple example, a trade being entered on H1 RSI extension followed by an entry signal, and running immediate to hit the profit target. If only all trades were that simple!
Comments are closed.