Consolidates the biggest daily fall in two months above 200-SMA
- USD/MXN pares heavy losses above the key moving average support, mildly bid of late.
- Downside break of weekly support line favors intraday sellers of the Mexican Peso pair.
- Bulls need validation from three-day-old descending resistance line, key Fibonacci retracement levels.
- Further grinding toward the south can be expected amid mixed oscillators.
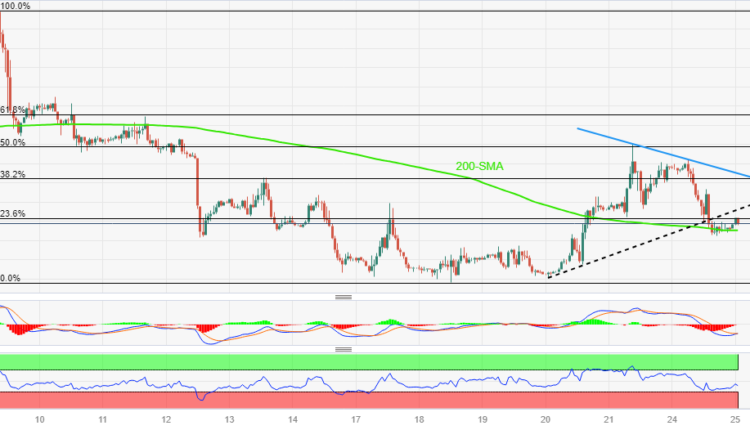
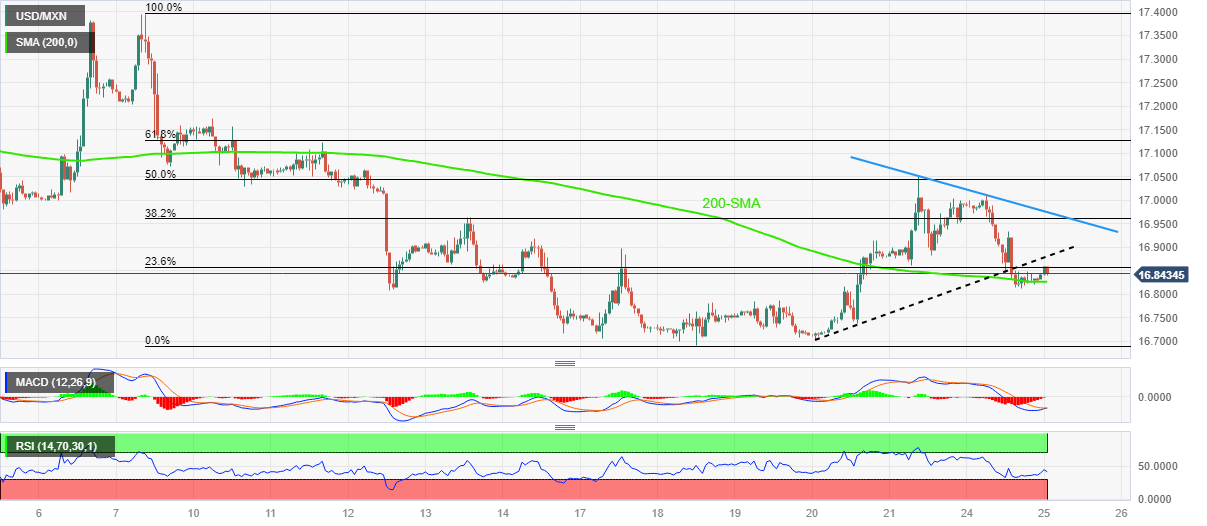
USD/MXN struggles to defend the previous corrective bounce off the 200-Hour Simple Moving Average (SMA) during early Tuesday morning in Asia, edges higher around 16.85 by the press time.
Although the 200-HMA restricts the immediate downside of the USD/MXN pair near 16.82, a clear downside break of the rising support line from July 20, now immediate resistance around 16.88, can prod the Mexican Peso (MXN) pair buyers.
It’s worth noting that the looming bull cross on the MACD defends the USD/MXN bulls amid a nearly oversold RSI (14) line.
That said, a successful break of the support-turned-resistance line, close to16.88 isn’t enough to convince the USD/MXN bulls as a downward-sloping resistance line from July 21, close to 16.98, quickly followed by the 17.00 round figure, can test the pair buyers.
Following that, a run-up toward the monthly high of around 17.40 can’t be ruled out.
On the flip side, a clear break of the 200-SMA support of near 16.82 becomes necessary to convince the USD/MXN sellers.
Even so, multiple levels marked since July 18 prod the pair bears around 16.78 before directing them to the late 2015 region tested the last week around 16.69.
USD/MXN: Hourly chart
Trend: Limited downside expected


Comments are closed.