Combination Of MSB(Market Structure Break Out) And Unbroken Zones – Trading Strategies – 17 December 2023
Introduction to MSB and Unbroken Zones :
Welcome to this blog post. I am excited to delve into one of the major and meaningful concepts in the forex market – the structure of price movement and the creation of supply and demand zones following market movements. In the article below, I aim to illustrate how MSB, or Market Structure Breakout, operates and how we can interpret market price movement as waves using MSB tools. Subsequently, I will demonstrate how unbroken supply and demand zones can be formed based on MSB waves. Finally, we will integrate these two concepts and attempt to generate entry buy and sell signals through the combination of MSB and unbroken zones.
How MSB form market waves ?
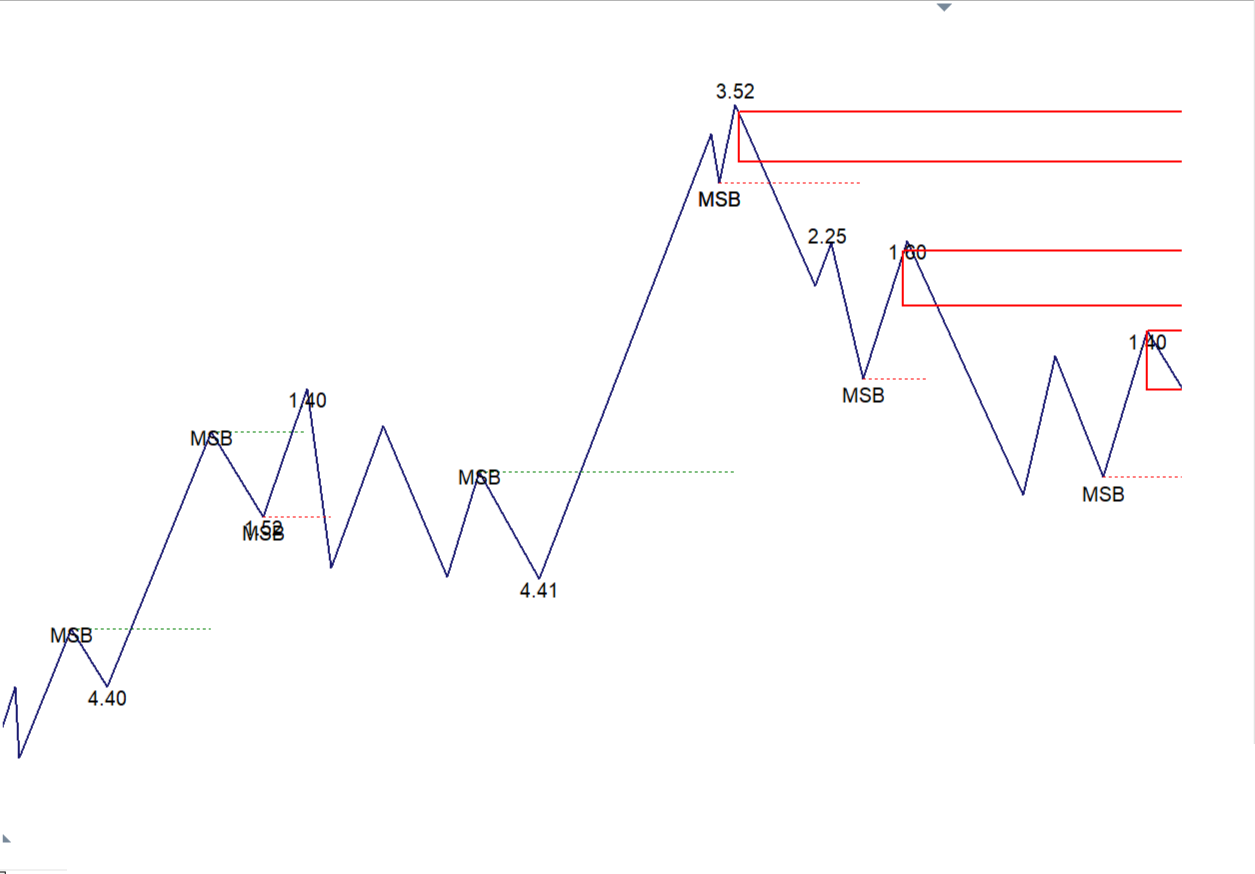
The MSB, or Market Structure Breakout, originates from a regular zigzag indicator or similar indicators that display high and low points. When we connect these points, we create a wave. If the market price experiences a sharp movement, a new wave can break out, leading to the formation of an MSB or market structure breakout. The MSB line, indicating where the latest market structure has been broken, holds significant importance in pricing. Equally crucial is the lowest or highest point from which this new wave originates. Take a look at the image below; it can help you understand how MSB forms and how a new wave is shaped in the market.

How unbroken supply and demand zones form and why they are important ?
When the market movement changes its direction, it reaches a peak or trough, creating a price wave. This wave remains unvisited by the market, generating a significant zone. Such a zone can function as either a supply or demand area. If the zone is situated below the current price and originates from the lowest point, it becomes a demand zone. Conversely, if it is higher than the current price and stems from the highest point, it transforms into a supply zone. Notably, if the market has yet to breach this zone, it is considered fresh and unbroken. Unbroken zones are reliable areas, and we anticipate market interactions with these zones. Therefore, they present favorable conditions for various signal generation strategies, particularly those based on price action. According to statistical analysis, price action strategies tend to exhibit higher success rates within these zones compared to areas outside of them.
How buy and sell signals generate and how you can use them to reach good entry :
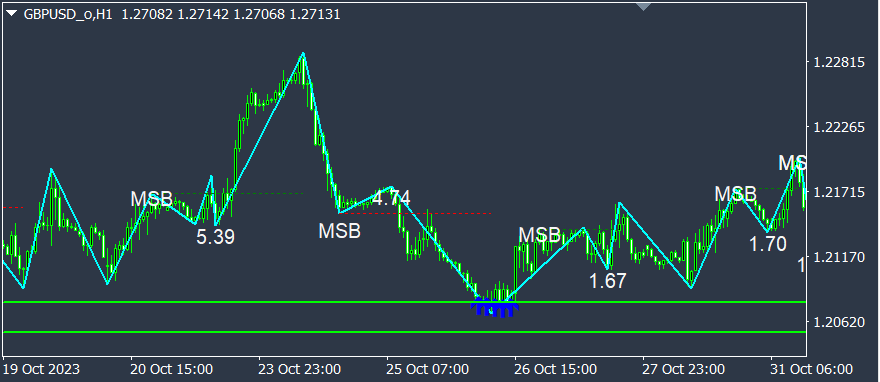
When market price enter inside demand zone, price volatility and speed is less , we except price rejection, in this case as soon as one new candle for inside zone but closed out of zone in reverse direction we assume its good buy entry time like below image.

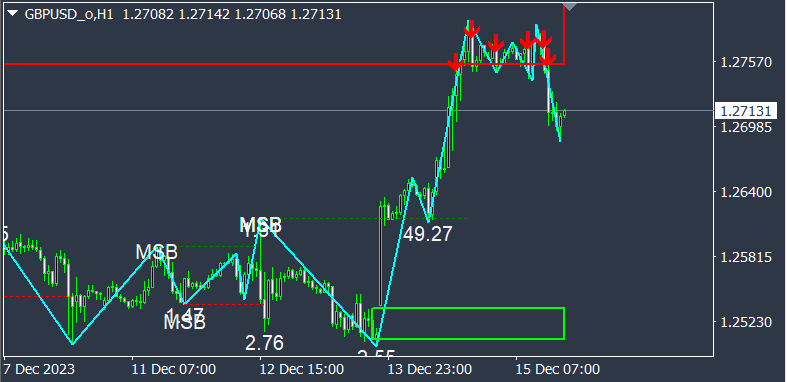
we have exactly same and reverse scenario for generating sell signals based on supply zones like below image :

What indicator can show these MSB and signals ?
Market Structure Break Out indicator is accessible in MQL5 Market , this indicator designed for drawing MSB waves supply and demand zones, signals and alerts , all above images comes from this indicator , indicator is download able from below link :
https://www.mql5.com/en/market/product/109958
Conclusion :
MSB or Market Structure Break Out is one of very pure analysis system can show us how market behavior work as waves and also can help us to understand how supply and demand zones form , these zones are trustable areas for any kind of price action strategies , also these zones can guide us where is best stop loss price (behind of zones) , so by combination of MSB and unbroken zones concept we can reach good strategizing strategy.


Comments are closed.