CHAT GPA Guide – Other – 13 May 2023
CHAT GPA Guide
MT4: mql5.com/en/market/product/97113
MT5: mql5.com/en/market/product/97114
The module made for Metatrader software allows the user to chat with the system. With this module, the user can give commands to the system and automatically execute the desired function for him. This tool is very simple and efficient and makes Metatrader easier and faster to use.
This module can act as an interface between the user and the system and helps the user to send Metatrader orders to the system easily and quickly. This tool, through the use of natural language processing technologies, allows the user to chat with the system in a natural way and simply give his orders to Metatrader to perform trading.

This module has the ability to support more complex commands and allows users to easily use these commands.
In short, this module allows users to give more complex commands to the system by using chat with the system and it will automatically perform the desired function for them. This tool makes it easier and faster to use Metatrader and allows users to make the most optimal use of Metatrader's facilities by spending the least amount of time and effort.
We will try to teach this module with more examples
All the commands are entered in the box in the special software
1. Example in the orders
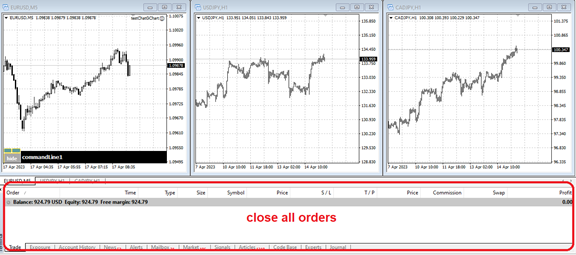
• Close all orders >> It closes all transactions such as buying and selling that are open
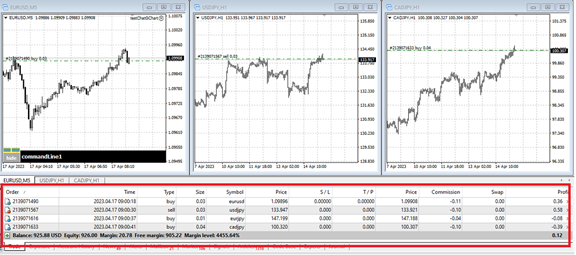

• Close all orders buy >> Closes all open buy trades

• Close all orders sell >> Closes all open sell trades
• Close last order buy >> Closes the last open buy trade
• Close last order sell >> Closes the last open sell trade
• Close first order buy >> Closes the first open buy trade
• Close first order sell >> Closes the first open sell trade
• Close last order >> Closes the last trade you opened. The last trade may be sell or buy
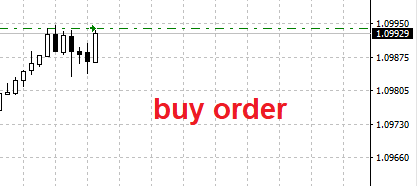
• Open a buy order with lot 0.01 >> A buy order is executed with a volume of 0.01 without profit and loss limits
• Open a buy order with lot 0.01 and stop loss price 1.12365 >> A buy order with a specified stop loss price
• Open a buy order with lot 0.01 and profit price 1.12365 >> A buy order with a specified profit price
• Open a buy order with lot 0.01 and stop loss price 1.12365 and profit price 1.12569 >> A buy order with a specified stop loss and profit price
• Open a buy order with lot 0.01 and stop loss pip 50.0 >> A buy order with a specified stop loss pip
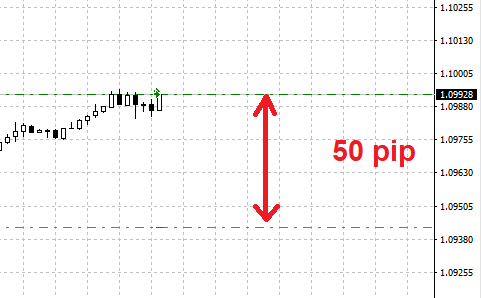
• Open a buy order with lot 0.01 and stop profit pip 50.0 >> A buy order with a specified profit pip
• Open a buy order with lot 0.01 and stop loss pip 50.0 and profit pip 50.0 >> A buy order with a specified stop loss and profit price
Also, you can specify another comment such as buy limit,buy stop,sell limit,sell stop for each order and set the expiration time of each transaction
2. Example in the chart setting
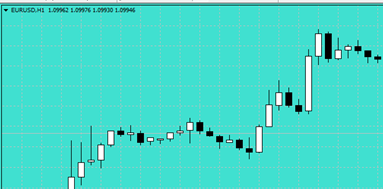
• Set background color Turquoise >> Set the desired chart color by writing the desired color
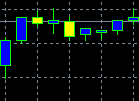
• Set bearish candle yellow >> Set the color bearish candle by writing the desired color
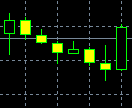
• Set bullish candle blue >> Set the color bullish candle by writing the desired color
You can also make changes in the shape of the chart by writing text similar to human language
3. Example in the object
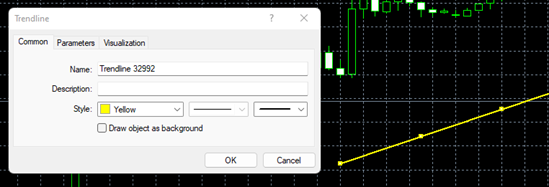
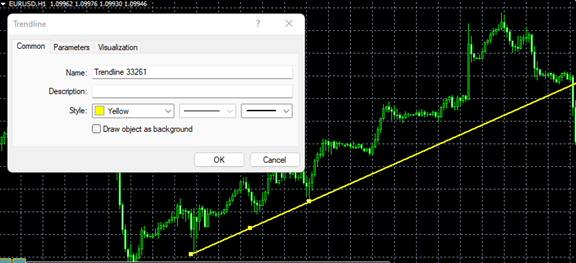
• Set Trendline 32992 color yellow >> By entering the name of the object you can do in its color
Using conditional commands
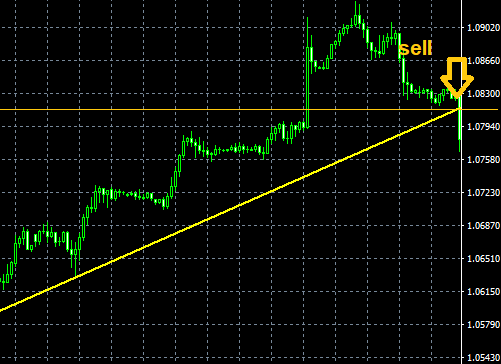
• if bid less Trendline 33261 alert ‘check the chart' >> It warns when the price falls below the trend line
After the market price reaches the trend line and goes lower, it gives a warning
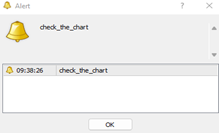
• if bid less Trendline 33261 alert order sell with lot 0.01 and sl price 1.09375 >> The same as the previous example, but when the desired trend line is reached, a sell order is executed
• if bid less Trendline 33261 alert notification ‘check the chart eurusd‘ >> The same as the previous example, but when the desired trend line is reached, a message is sent to the mobile phone
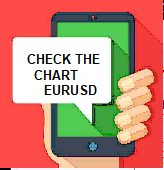
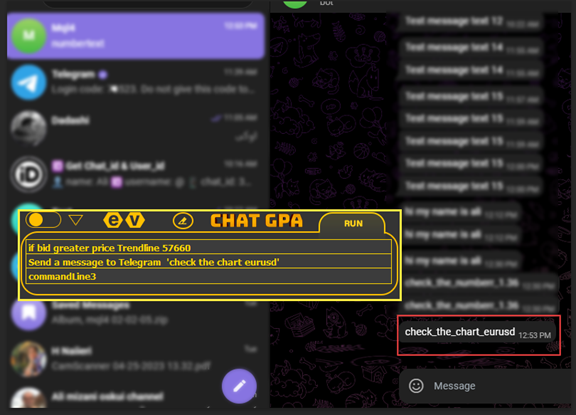
• if bid greater price Trendline 57660 Send a message to Telegram ‘check the chart eurusd' >>If the current price is greater than the trend line whose name we have entered, it will send a message to Telegram
• if bid less Trendline 33261 alert set background color red >> Like the previous example, but upon reaching the desired trend line, the color of the chart changes to red. This example is very suitable for those who have several monitors to check.
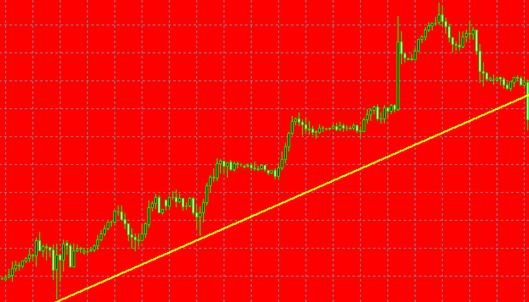
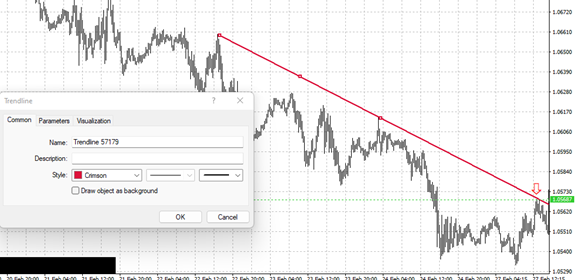
• if bid > Trendline 57179 order sell with lot 0.02 and alert ‘get order sell' >> When the price falls above the trend line, it warns to place a sell order
Various commands can be executed with other objects
• if bid greater Horizontal Line 35848 alert ‘check the chart' >> It warns when the price falls below the trend line
• if bid greater 1.06887 alert ‘check the chart' >> It can also be done if the price is greater than 1.06887 …
Now with a more complicated shape like the Andrews fork
• if bid greater price upper Andrews Pitchfork 36439 order sell with lot 0.01 and sl pip 70 and tp pip 90 >> A sell order is executed when the price hits the upper fork line
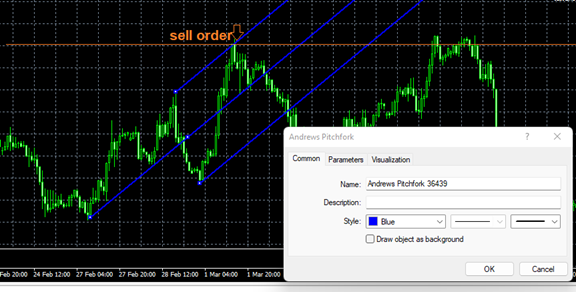
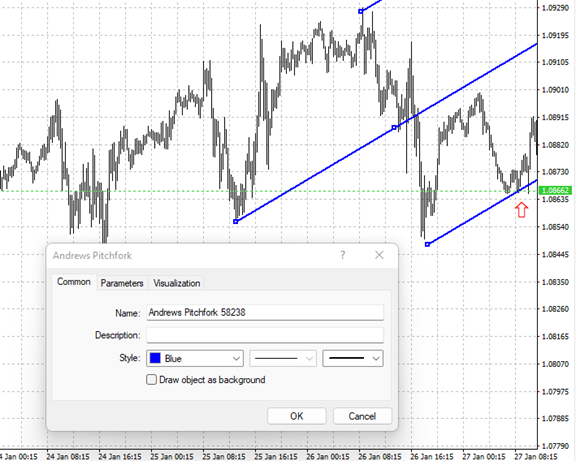
• if bid < price lower Andrews Pitchfork 58238 do a order buy with lot 0.01 and sl pip 70 and tp pip 90 >> A sell order is executed when the price hits the lower fork line
• if time current greater equal Vertical Line 58593 order buy with lot 0.01 >> A buy order when the market date reaches the line. This example is suitable for those using a time series strategy
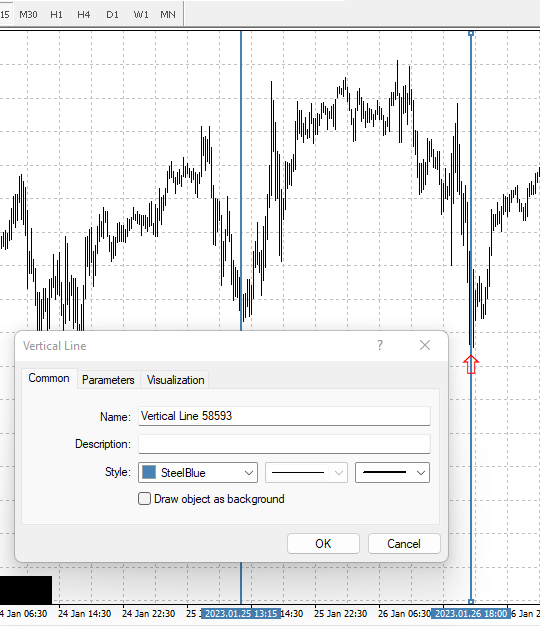
You can also use it for any other object, or if necessary, contact support to define other object
3. Example in the variables
It is better to use variables to write more complex modes
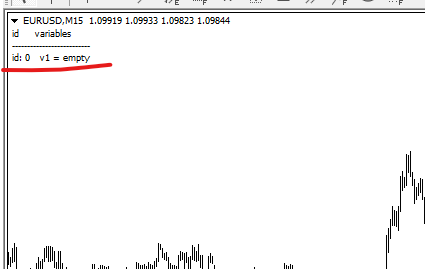
• Create a variable and set name ‘v1' >> With this text, a variable is created and its name is v1
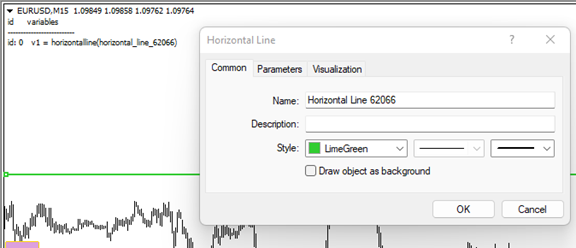
You can see the variable diagram on the top and left side
Each variable has an ID and its value is displayed in front of it
• Set v1 1.04521 >> With this text, The value of v1 is equal to 1.04521
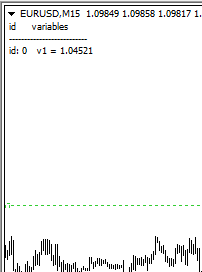
• Set v1 Horizontal Line 62066 >> With this text, The value of v1 is equal to price Horizontal Line 62066
• Set bid > v1 order buy with lot 0.01 and sl price 1.26954 and tp price 1.27954 >>When the price of the chart is higher than the value of the v1, which is the horizontal line, a buy order is made
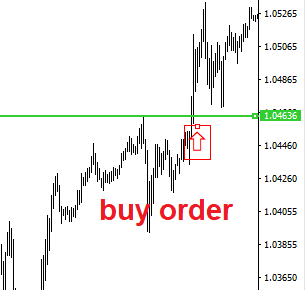
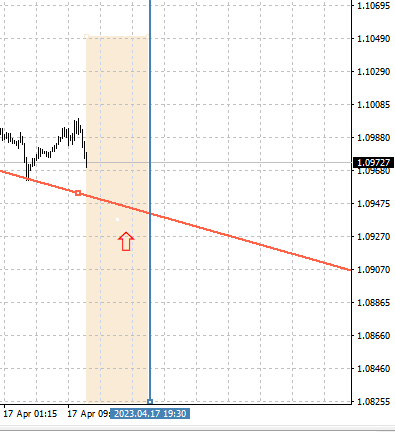
In this example, we define another conditional order that when the price hits the trend line and from the time it hits the trend line, it must be less than the vertical line in the chart to trade. In fact, we have defined an order with an expiration time.
We express this example in two ways. You must have the names of the objects
• if bid < Trendline 63023 and time current < Vertical Line 63032 order buy with lot 0.01 and tp pip 50 and sl pip 50
Another way to write this text is to equate each object with a variable and then compare the variables.
First, he created the variables
create a variable and set name ‘v1'
create a variable and set name ‘v2'
Then set the value of the variables
set v1 Trendline 63023
set v2 Vertical Line 63032
Now the final order
• if bid < v1 and time current < v2 order buy with lot 0.01 and tp pip 50 and sl pip 50
When your commands become more complex, it is better to use variables
4. Example in the indicators
A simple moving average strategy
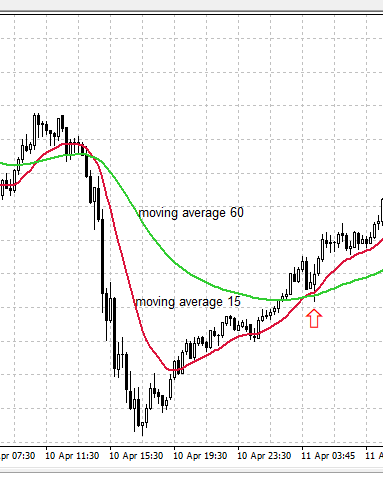
• if price moving average with period 15 > price moving average with period 50 order buy lot 0.1 with sl price 1.23621 << When the price of moving average 15 is greater than moving 50, it will place a buy order
In the default setting, ma method is equal to exponential and apply to is typical price
Another example with a custom setting
• if price moving average with period 15 with ma method simple > price moving average with period 50 order buy lot 0.1 with sl price 1.23621
You can use a lot of Moving average with different settings, we used only 2 Moving average
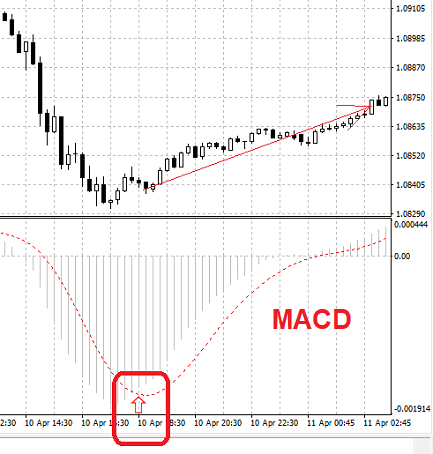
· if macd fast ema 12 and slow ema 26 mode main larger > macd fast ema 12 and slow ema 26 mode signal place order buy with Volume 0.2 << A buy order is placed when the value of the macd indicator exceeds its signal value
Another way to write this command
First, he created the variables
create a variable and set name ‘v1'
create a variable and set name ‘v2'
Then set the value of the variables
set v1 macd fast ema 12 and slow ema 26 mode main
set v2 macd fast ema 12 and slow ema 26 mode signal
Now the final order
• if v1 larger v2 place order buy with Volume 0.2 << A buy order is placed when the value of the v1 exceeds its v2
• if bid greater price upper bolling band with period 30 order sell with lot 0.1 and set tp price lower bolling band with period 30 << If the desired currency price hits the Bollinger band line, a sell order is made and the loss limit is set equal to the low price of the Bollinger band.

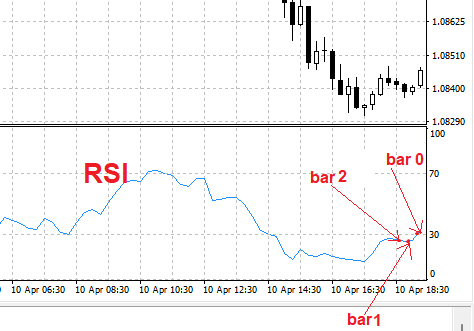
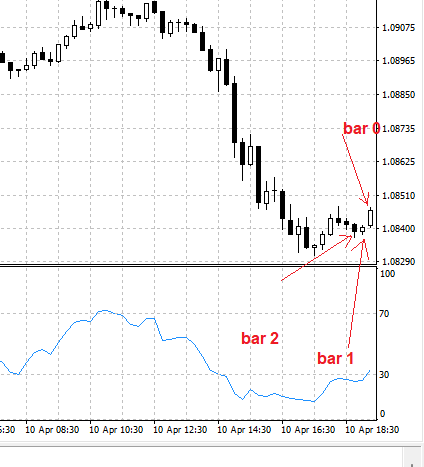
• if rsi with period 14 bar 2 < 30 and rsi with period 14 bar 1 > 30 order buy with sl price 1.08286 and tp price 1.08728 << In this example, it checks the value of the rsi indicator in two candles, if the Rsi of the first candle is below 30 and the rsi of the second candle is above 30, it will place a buy order.
By placing a number in front of the word “bar”, you can access the price or indicator of past candles , bar 0 is the current price or indicator
So far, some simple and professional examples have been given. You can implement all kinds of ideas according to your experience and knowledge of the market, and if necessary, contact the support to present your ideas so that your order is carried out in the market.
5. Another Example
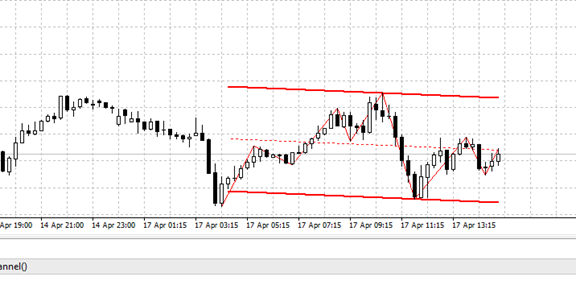
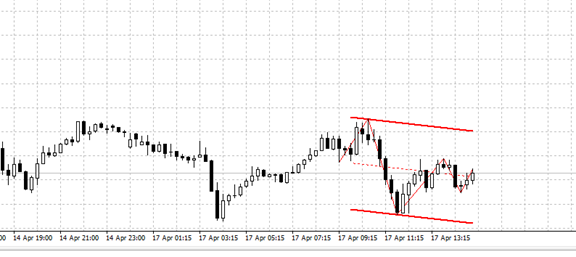
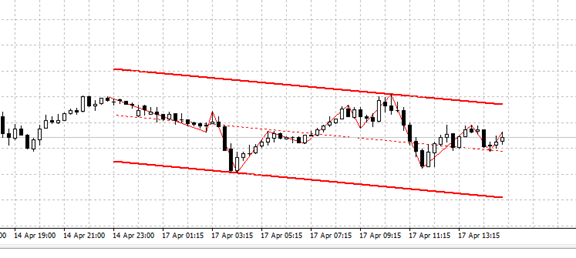
• show channel << By writing this text, a channel has been displayed in the market
By writing the text delete channel , it is removed from the chart
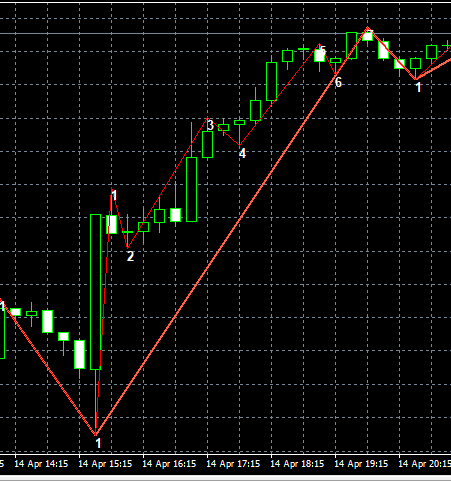
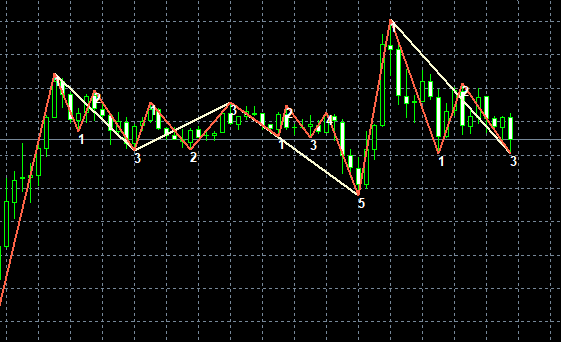
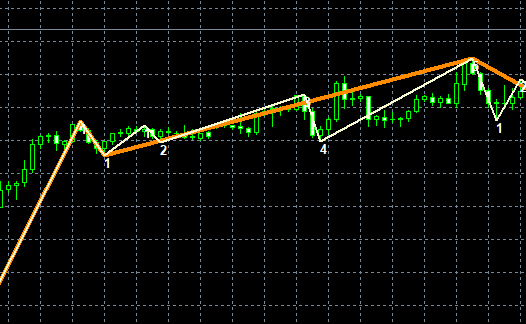
• show elliott wave << By writing this text, elliott wave has been displayed in the market
By writing the text delete elliott wave, it is removed from the chart
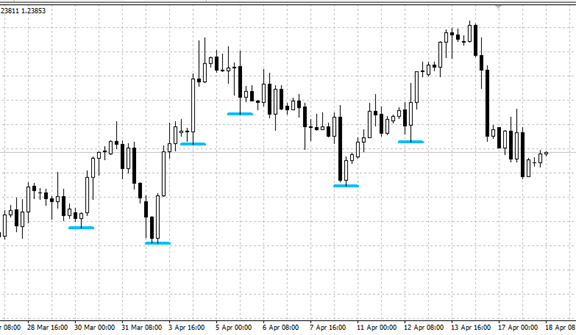
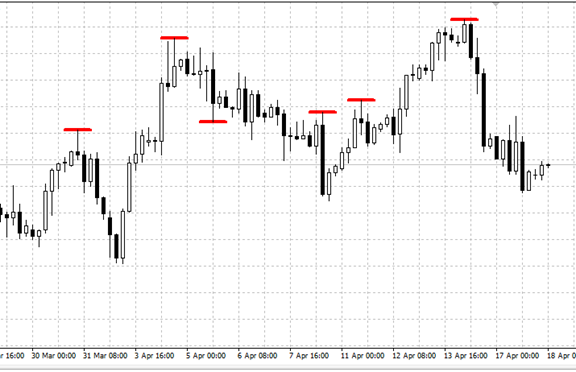
• show resistance << Displays a number of available top resistance in the chart
By writing the text delete resistance, it is removed from the chart
• show support << Displays a number of available top support in the chart
By writing the text delete support, it is removed from the chart
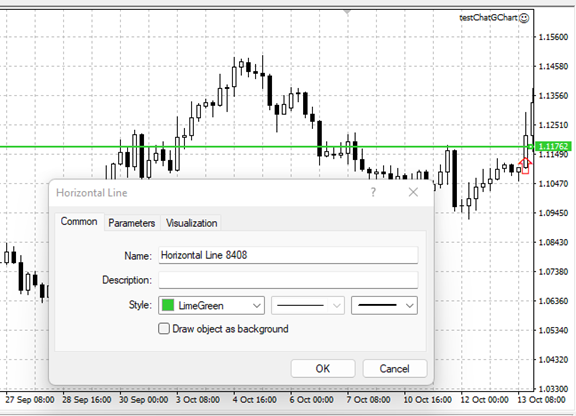
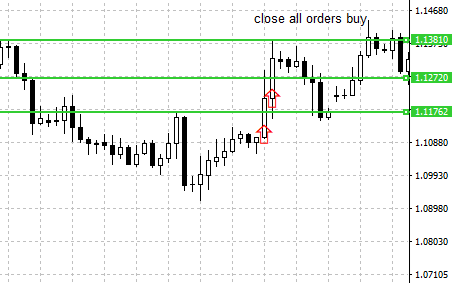
An example of a step buy
In this example, we want to give an order to make buy in two stages and close all buy in the third stage
In this example, we have shown separate lines, but you must first draw all the desired lines and enter the three code steps in one place.
• if bid > Horizontal Line 8408 do a order buy with lot 0.01 << If the price reaches the desired line, it makes a purchase with a volume of 0.01
• if bid > Horizontal Line 8408 do a order buy with lot 0.01 << If the price reaches the desired line, he makes another purchase with a volume of 0.01
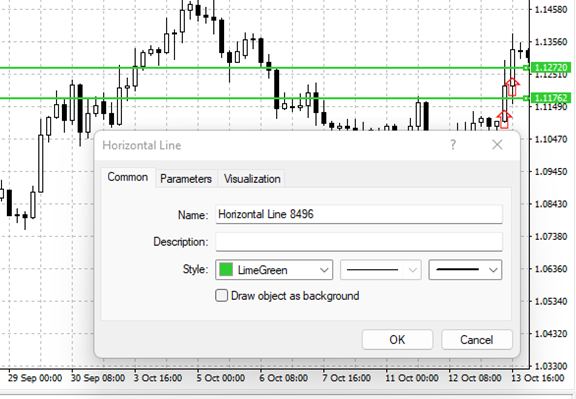
• if bid > Horizontal Line 8647 close all buy orders << Closes all buy orders
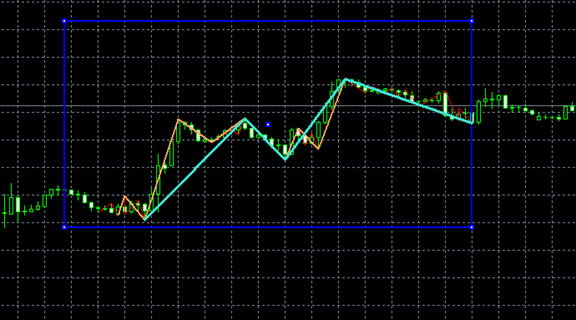
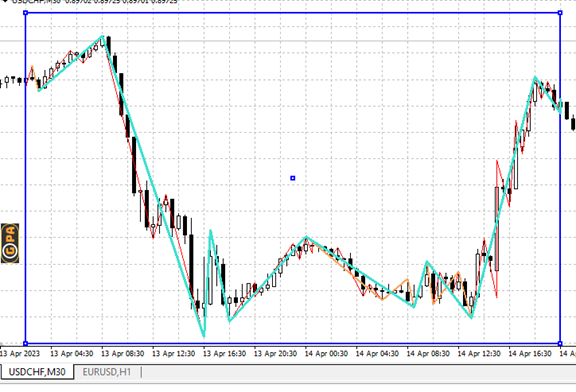
• show the waves panel << Showing a panel in the chart, by moving it in the chart, you can observe all kinds of big and small waves in the market.
By writing the text delete the waves panel, it is removed from the chart
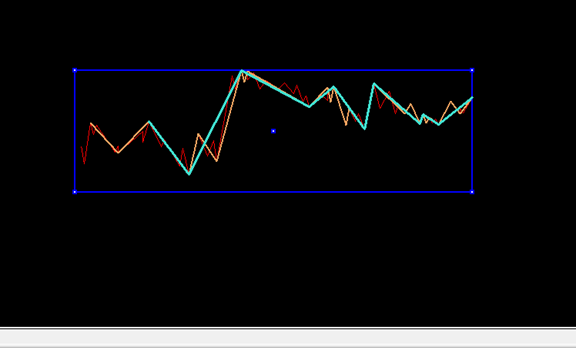
• Delete all chart elements << It disables all the elements in the chart, such as the color of the candle ,By moving the panel, you can see the past and the future
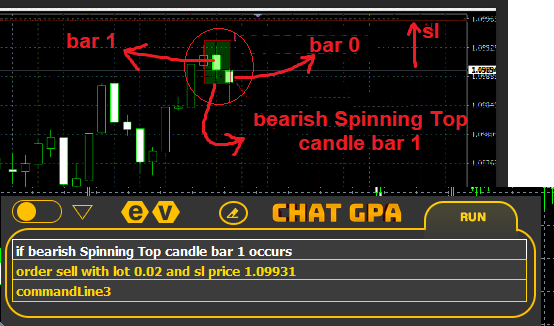
• if bearish Spinning Top candle bar 1 occurs placed order sell with lot 0.02 and sl pip 1.099534 << When the desired candlestick pattern occurs, execute a sell order
It supports the following candle patterns and if needed, contact support to add the pattern you want
bearish Spinning Top
gravesone Doji
shooting Start
hanging Man
bullish Spinning Top
dragonfly Doji
hammer Candle
inverted Hammer Candle
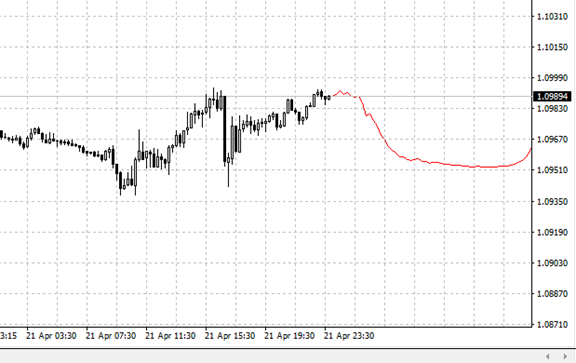
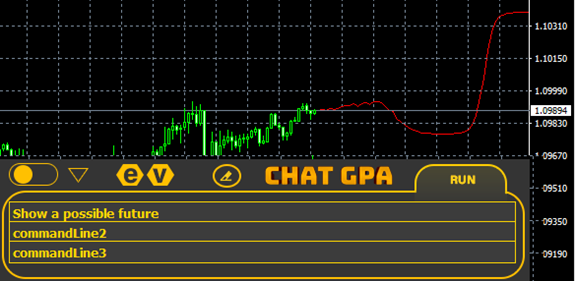
• Show a possible future << Based on the patterns that happened in the past, a possible pattern of the future has been displayed
By writing the text delete possible future, it is removed from the chart
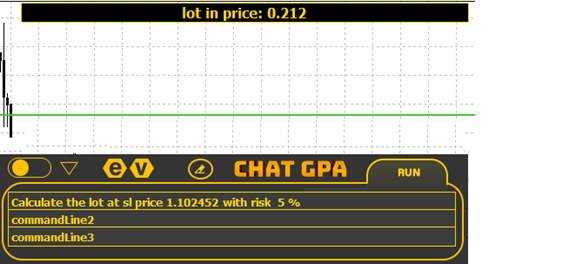
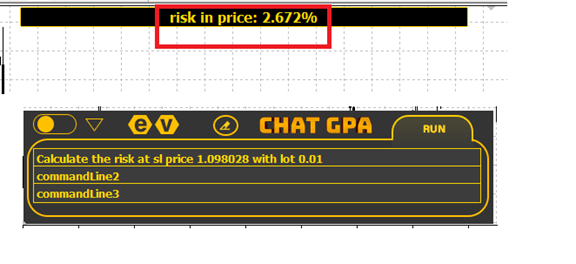
• Calculate the risk at sl price 1.098028 with lot 0.01 << You can also calculate the risk of your trade by entering price or volume
• Calculate the risk at sl pip 50 with lot 0.01
• Calculate the lot at sl price 1.098028 with risk 5 %
• Calculate the lot at sl pip 50 with with risk 5 %
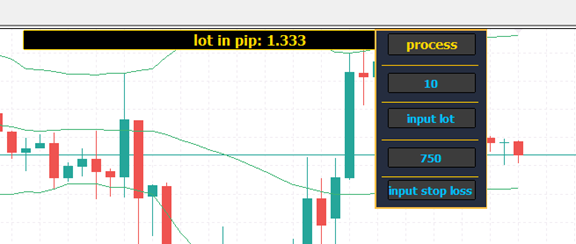
You can also enter your calculations as a panel
• open the panel risk
• show the panel risk
A panel is opened above the chart and you can enter the values and press the process button to calculate
Formula writing is needed for more complex strategies
Here I give an example
• create a variable and set name ‘v1'
• create a variable and set name ‘v2'
• set v2 formula (v1*2+v1*2+v1*2)
• set v1 3
We create two values and set the second value equal to the written formula
And we make the value of v1 equal to the number 3
As a result, v2 is equal to the number 18
In your strategy, you can combine indicator and formula and number or price or geometric shapes and design a strategy according to your desire.
An example in the chart
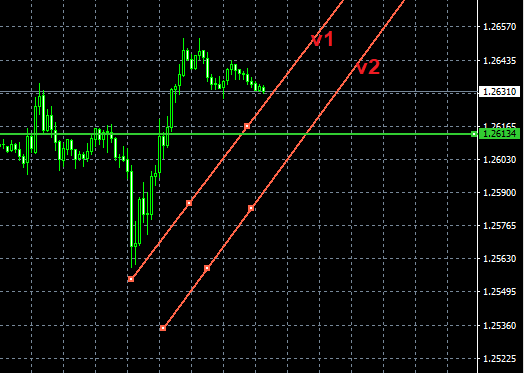
Suppose you have two trend lines and you want to find the distance between the two trend lines and set your profit or loss limit according to the distance between the two trend lines.
• create a variable and set name ‘v1'
• create a variable and set name ‘v2'
• create a variable and set name ‘v3'
• create a variable and set name ‘v4'
• set v1 Trendline 62168
• set v2 Trendline 62172
• set v3 formula (v1-v2)
• set v4 formula (bid-v3)
The upper trend line is equal to the v1 value
The lower trend line is equal to the value of v2
The value of v4 is equal to the distance between the two and the trend line
Now put a sell or buy order and set your profit or loss limit according to the formula
• if bid < v1 then order buy with lot 0.01 and sl price v4 << If the price falls below the desired trend line, which is v1, we place a sell order with a profit limit of v4
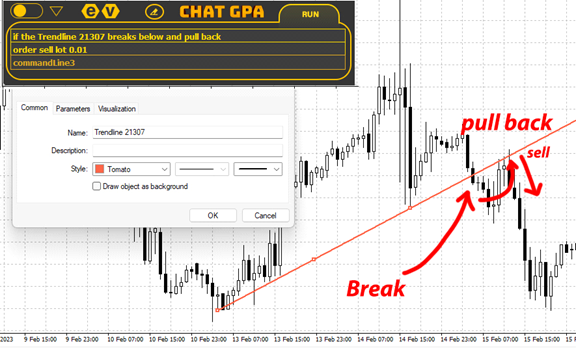
• if the Trendline 21307 breaks below and pull back order sell lot 0.01 >>In this example, when the price breaks the trend line and has a pullback, it makes a sell trade towards the trend line
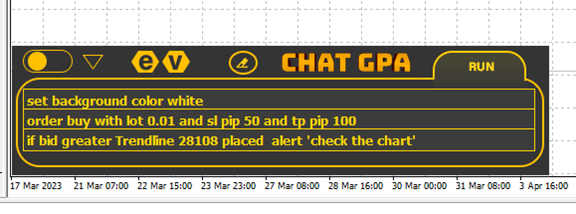
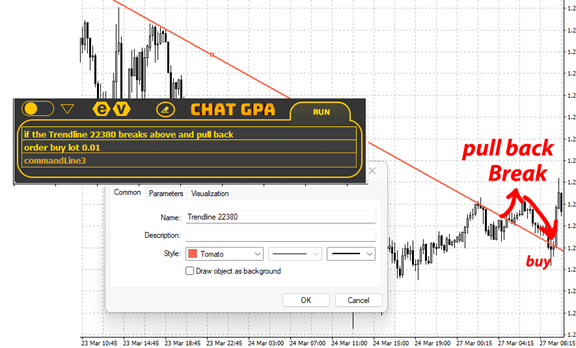
• if the Trendline 22380 breaks above and pull back order buy lot 0.01 >>In this example, when the price breaks the trend line and has a pullback, it makes a buy transaction towards the trend line





Comments are closed.