Chart Art: Trend Retracement Levels on GBP/JPY and EUR/AUD
Ready to go with the flow today?
Check out these textbook trend correction setups on the 4-hour chart of GBP/JPY and the hourly chart of EUR/AUD.

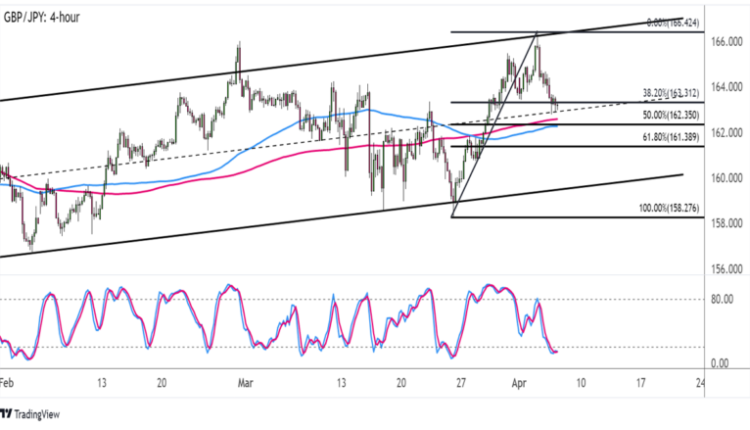
GBP/JPY 4-hour Forex Chart by TradingView
Let’s start off with this simple channel correction on the 4-hour chart of Guppy.
The pair is already retreating from the resistance and is in the middle of a pullback to the mid-channel area of interest.
If this is enough to keep losses at bay, pound bulls could set their sights back on the swing high at the 166.42 level or the channel top.
A larger retracement could still reach the 61.8% Fib at 161.39 or the very bottom of the rising channel closer to the 160.00 major psychological support.
Stochastic is showing that sellers are getting quite tired, but buyers don’t seem ready to hop in just yet until the oscillator pulls higher.
At the same time, the 100 SMA is still below the 200 SMA to reflect bearish pressure, but it seems that a bullish crossover is due.

EUR/AUD 1-hour Forex Chart by TradingView
Next up is this trend line correction setup that already seems to be playing out on the hourly chart of EUR/AUD.
The pair appears to be finding buyers at the 50% Fib, which is near the dynamic support at the moving averages. This happens to be right in line with an area of interest or former resistance zone, too!
A larger pullback might reach the 61.8% Fib closer to the 1.6175 level and the ascending trend line support, but Stochastic seems to be hinting that buyers are back in the game.
Moving averages aren’t so convinced just yet, as the indicators are oscillating to suggest rangebound conditions.
Still, if any of the support levels hold, EUR/AUD could set its sights back on the swing high near the 1.6400 major psychological mark and beyond!


Comments are closed.