Chart Art: Trend Extension and Breakouts on AUD/JPY and AUD/NZD
Who’s ready to trade the Australian dollar?
I hope you are because AUD/JPY and AUD/NZD are sitting on key support and resistance levels!
Check out their 1-hour charts:

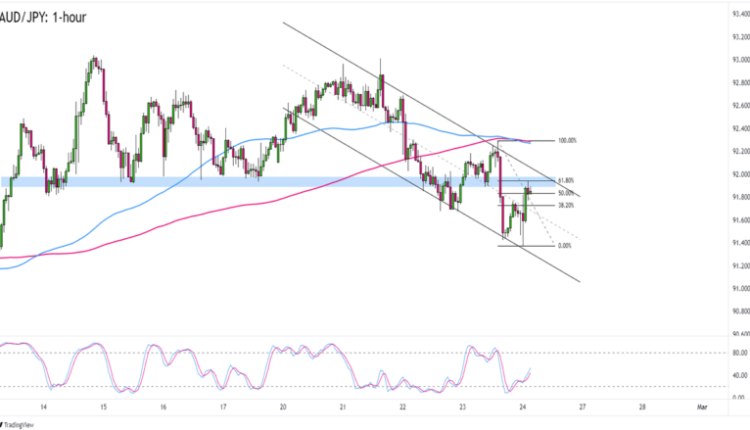
AUD/JPY 1-hour Forex Chart by TradingView
I spy with my eye a trend continuation opportunity!
AUD/JPY is consolidating just under the 92.00 psychological that lines up with the top of a descending channel that’s been around all week.
In this case, AUD/JPY is also sitting close to the 50% Fibonacci retracement of yesterday’s downswing and a key support zone from last week.
Moving averages are pointing to more bearish moves as the 100 SMA crosses below the 200 SMA.
Look out for more AUD selling that could drag AUD/JPY down to its intraweek lows.
Not confident that AUD/JPY will soon face bearish pressure? You can also wait for a retest of the actual channel resistance or a couple more bearish candlesticks before you trade this week’s trend.

AUD/NZD 1-hour Forex Chart by TradingView
Breakout alert! This week, AUD/NZD broke a trend line that had been serving as support all February.
With price bouncing lower from the broken trend line AND the 100 SMA crossing below the 200 SMA, you can bet that at least some AUD bears are on to this setup.
Before you sell AUD/NZD like it’s the cheapest Beyoncé concert ticket available though, you should note that Stochastic is showing a bullish divergence against the pair’s prices.
AUD/NZD hanging out near its intraweek lows may make it easier to buy the pair in case traders find AUD-friendly market themes.
If AUD/NZD starts to gain traction from the 1.0925 support, then you should also be ready for a trip back to yesterday’s 1.0960 highs.


Comments are closed.