
Heads up, yen traders!
Both GBP/JPY and NZD/JPY are currently testing upside barriers visible on their short-term charts.
Will bearish momentum pick up or is there a chance for a breakout?

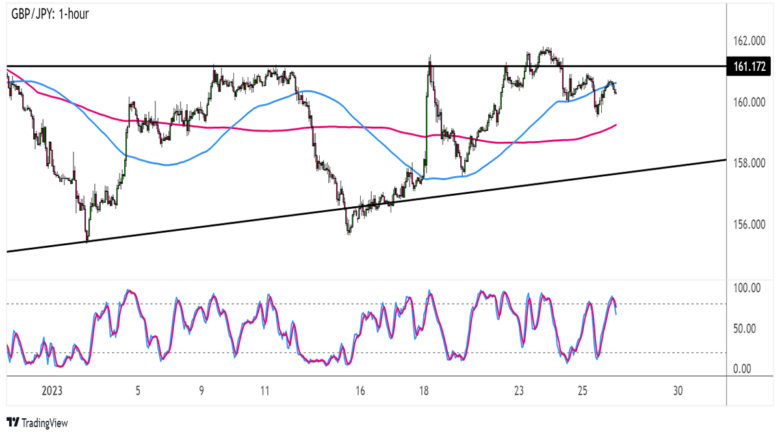
GBP/JPY 1-hour Forex Chart by TradingView
Guppy has formed higher lows and hit a ceiling at the 161.00 area, creating an ascending triangle pattern.
The pair already bounced off the triangle top and might be setting its sights on support around the 158.00 handle from here.
But what are technical indicators saying?
Stochastic is in favor of more bearish action, as the oscillator already reached the overbought region to reflect exhaustion among buyers. It looks ready to head south, so price could follow suit.
However, the 100 SMA is above the 200 SMA to indicate that buying pressure is still present. In that case, GBP/JPY might make another test of resistance and even attempt to break out.
If that happens, watch out for a rally that’s the same height as the chart formation. That’d be roughly 500 pips yo!

NZD/JPY 1-hour Forex Chart by TradingView
Missed the range resistance bounce on NZD/JPY?
There might still be plenty of room for the selloff to keep going, as the bottom of the range is all the way down at the 81.85 area.
Just make sure you keep an eye out for the nearby support zones, though!
The middle of the range around the 83.00 major psychological mark might still hold as an area of interest, especially since it lines up with the 200 SMA dynamic support.
After all, the faster-moving 100 SMA is above the 200 SMA to suggest that support levels are more likely to hold than to break.
Also, Stochastic is starting to pull higher from the oversold region, which means that buyers are getting back in the game.
Stay on the lookout for another test of the range resistance at 84.75 if bullish pressure picks up. Do you think a bullish break is bound to happen, too?
Comments are closed.