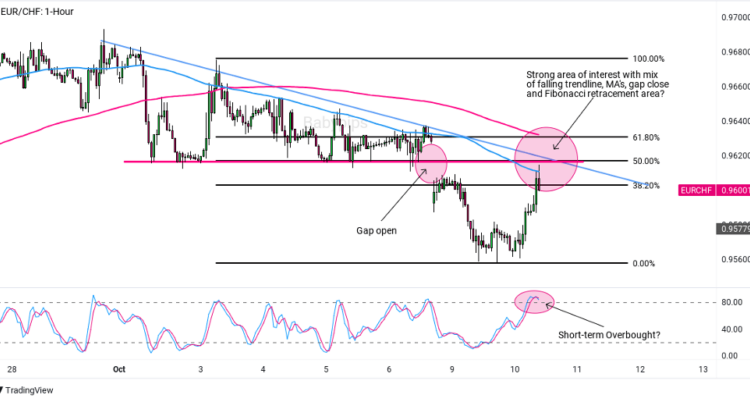
Chart Art: Strong Area of Interest on EUR/CHF
What’s up trading fiends!
EUR/CHF broke lower right at the week open, and after a swift move down and up, the gap is being retested, along with a ton of technical arguments.
Is this a strong area of interest to potentially draw in more sellers into the fresh downtrend?
EUR/CHF: 1-Hour

EUR/CHF 1-Hour Forex Chart by TradingView
It’s not too often that we get gaps in the forex market, so it’s attention worthy when one pops up on the radar! That’s exactly why we’re checking out EUR/CHF, especially now that prices are back after a quick drop lower.
On the one hour chart above, we can see that this week opened up with a gap lower from the Friday close of 0.9628 to a Monday open of 0.9592. Risk-off vibes due to geopolitical catalysts were the likely culprit, and likely why EUR/CHF moved lower through the Monday session.
But the pair has bounced today on Tuesday, bringing the market back to the gap and raising the question of whether or not the gap will fill, a scenario that tends to draw in traders to resume the overall trend, in this case lower.
The gap also coincides with several technical arguments to likely draw traders’ attention, including a retest of falling ‘highs’ trendline, falling moving averages, a broken minor support area that lines up with the 50% Fibonacci retracement area.
Along with on chart technicals, the stochastic indicator is signaling potentially overbought short-term conditions.
So the question for technicals out there is whether or not this will draw enough sellers back to continue the downtrend? Or will the bulls push the market further and break that very strong area of technical interest?
As always, it’s mostly up to the fundamentals, but for now this is something to have on the radar and if bearish reversal patterns emerge if you’re a bear, then it may be time to work on a risk management plan that aligns with that bias and your individual trading situation.


Comments are closed.