Chart Art: Spot Gold’s (XAU/USD) Trend Pullback Play
Looking for commodity setups to trade?
I gotchu!
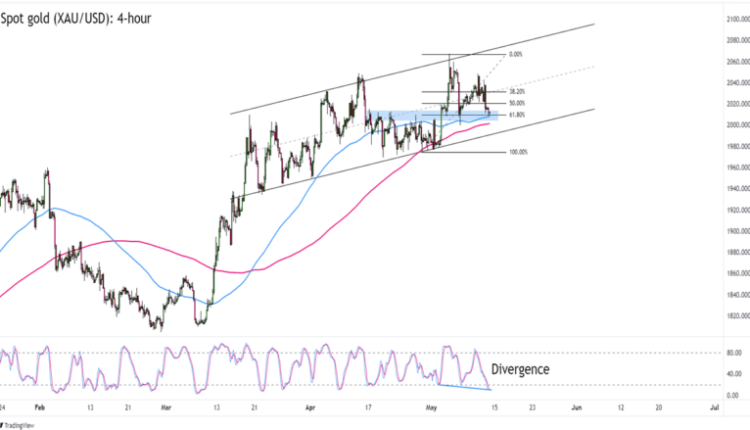
Take a look at gold prices hanging out near a key trend support zone:

Gold (XAU/USD) 4-hour Chart by TV
If you’ve been watching gold prices for a while, then you’ll know that spot gold has been killing the U.S. dollar since mid-March when XAU/USD took off from the $1,810 levels.
In fact, XAU/USD has been trading inside an observable ascending channel since late March.
Can gold bugs keep the party going in the next few days?
XAU/USD is approaching the $2,000 psychological handle that lines up with the 4-hour chart’s 100 and 200 SMAs and the 61.8% Fibonacci retracement of May’s upswing. It’s also not too far from the bottom of the channel that we’ve spotted.
And then there’s the bullish divergence on the 4-hour time frame as Stochastic hits a deeper “oversold” level while price makes higher lows.
A long trade at the $2,000 mark would yield a decent risk ratio especially if you place your stops just below the channel and aim for XAU/USD’s May highs near $2,070.
Before you buy like there’s no tomorrow, though, you should note that the 100 and 200 SMAs look like they’re flattening, which suggests a slowdown of the uptrend’s momentum.
If XAU/USD traders decide to keep the pair in a range instead, then we could see a move down to the $1,970 levels before gold sees more buyers.
What do you think? Which way will XAU/USD go?


Comments are closed.