
Missed this trend line breakdown on GBP/CAD?
If you’re still bearish, you might have a chance to catch the selloff on this pullback.
Check out these resistance levels where pound bears might be looking to jump in.

GBP/CAD 1-hour Forex Chart by TV
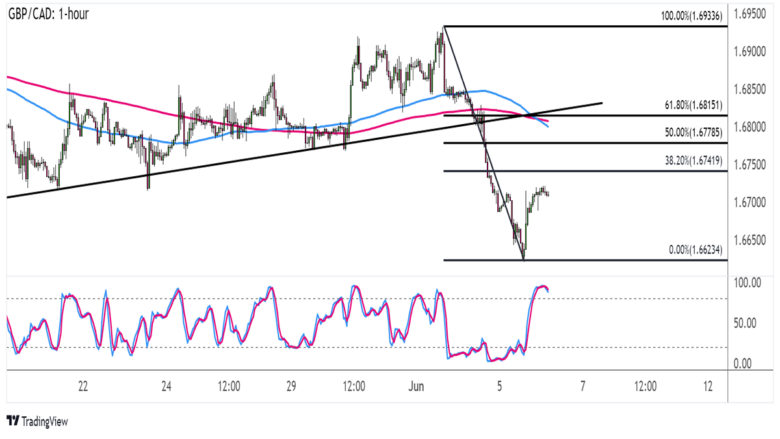
As you can see on the pair’s hourly time frame, price fell through an ascending trend line that had been holding over the past couple of weeks.
GBP/CAD fell straight through before finding a floor at 1.6623 and pulling back up. Using the Fib tool shows potential levels where bearish pressure could return.
Price is already closing in on the 38.2% Fib near the 1.6750 minor psychological mark, and holding as a ceiling could send the pair back down to the swing low or lower.
A higher correction could reach the 50% level at 1.6778 or the 61.8% Fib that’s right smack in line with the former trend line and dynamic inflection points at the moving averages.
The 100 SMA juuust made a bearish crossover from the 200 SMA to signify a change in trend, hinting that resistance levels are more likely to hold than to break.
At the same time, Stochastic made it to the overbought region to reflect exhaustion among buyers, so the pair could follow suit as soon as the oscillator moves south.
Better take the average GBP/CAD volatility into account when playing this one!
Comments are closed.