Chart Art: Potential Triangle Breakouts on CAD/CHF and AUD/CAD
Check out these Loonie pairs bracing for big moves!
Better keep your eyes on these levels if you’re going for a breakout.

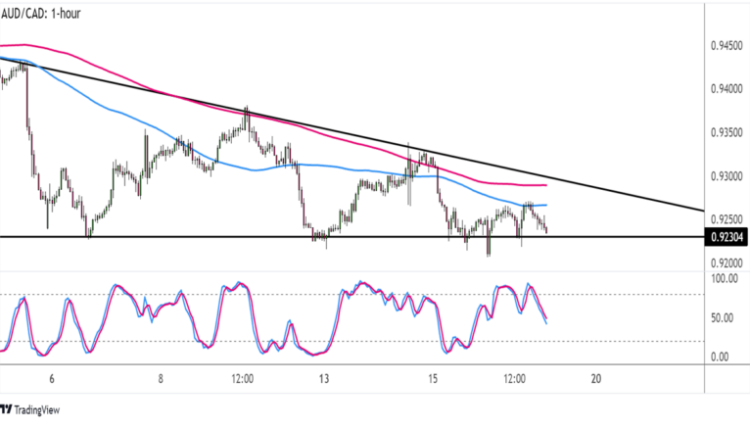
AUD/CAD 1-hour Forex Chart by TradingView
First up, we’ve got this neat descending triangle on the hourly chart of AUD/CAD.
The pair is already testing the triangle support and probably bracing for a bearish breakout. Blink and you might miss it!
Technical indicators are also pointing to more losses for the pair. The 100 SMA is below the 200 SMA to reflect bearish pressure and is currently holding as dynamic resistance.
Meanwhile Stochastic is on the move down, so AUD/CAD could follow suit while selling momentum is in play. The oscillator has plenty of room to head south before reaching oversold conditions.
A break below the .9230 area could set off a drop that’s the same height as the chart pattern, which spans approximately 200 pips.
On the other hand, if Aussie bulls still defend the floor, another move up to the triangle top around .9300 could follow.

CAD/CHF 4-hour Forex Chart by TradingView
Not sure where the Loonie might be headed next?
Perhaps a straddle setup on this symmetrical triangle pattern could let you catch either direction!
CAD/CHF appears to be finding support at the bottom of the formation, so another test of the resistance around .6925 could be in order.
Strong bullish vibes could spur an upside breakout, which could then be followed by a rally that’s the same size as the triangle formation.
That’d be roughly 150 pips yo!
Stochastic has some ground to cover before indicating exhaustion among sellers, but the oscillator is already showing signs of pulling higher and attracting buyers.
Moving averages are oscillating, barely providing strong directional clues but still holding as dynamic support for now.
In any case, make sure you check the average volatility of this pair when setting entries and exits!


Comments are closed.