Chart Art: Potential Pullback Resistance for the U.S. Dollar Index (DXY)
The U.S. dollar index (DXY) is approaching a key resistance zone!
Will the Greenback soon give up its upswing?
Let’s take a look at the 4-hour chart:

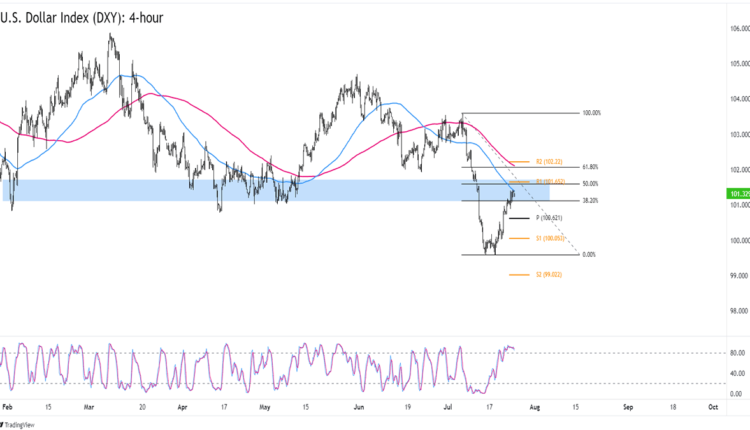
U.S. Dollar Index (DXY) 4-hour Forex Chart by TV
As you can see, DXY had fallen from the 104.00 area of interest and was making lower highs and lower lows until it found buyers in mid-July.
The index is now trading above 101.00, which is pretty close to the 100 SMA on the 4-hour time frame.
Not only that, but the dollar’s current levels are also not far from the 50% Fibonacci retracement of July’s downswing AND the R1 (101.65) Pivot Point level on the chart.
Will the dollar turn lower at the resistance area?
The index hasn’t quite turned lower just yet, so it looks like you still have time to whip up trading plans if you’re planning on trading the setup.
For now, watch out for bearish candlesticks and maybe a bit of bearish momentum that could point to DXY extending its downtrend.
A stop above the R1 zone and 50% Fibonacci level would yield a good risk ratio especially if DXY drops back to its July lows.
Good luck and good trading this one!


Comments are closed.