Chart Art: Nearby Inflection Points on Apple Inc (AAPL) Shares and CAD/JPY
Looking to trade a pullback?
Or hoping to keep things simple with a range setup?
Check out these support and resistance levels on Apple shares and CAD/JPY!
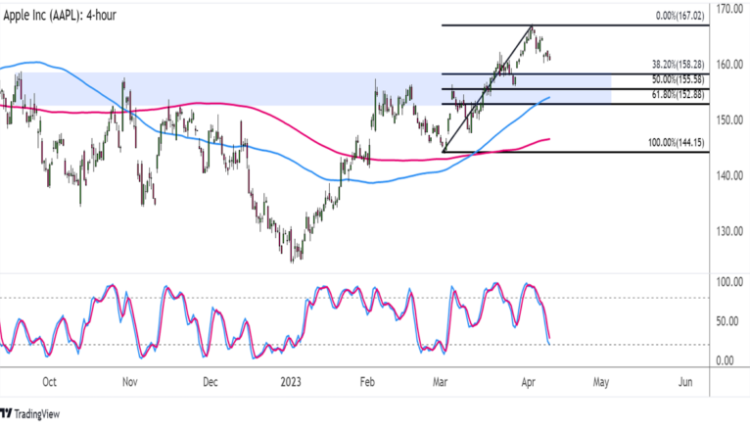
Apple Inc (AAPL): 4-hour

Apple Inc (AAPL) 4-hour Chart by TradingView
Missed this bullish breakout on Apple shares?
You might still have a chance to catch the short-term pullback… if you keep tabs on these Fib retracement levels!
The former resistance zone around $153 to $158 is spanned by the 61.8% to 38.2% levels, which means that buyers might be hanging out around this area.
Just note that Stochastic still has a bit of room to head south before reaching the oversold region, so the correction could keep going until the oscillator reflects exhaustion among sellers.
There’s a strong likelihood that the area of interest might hold as support since the 100 SMA is above the 200 SMA and is also in line with the 61.8% Fib.
If any of the support levels are enough to keep losses in check, brace yourselves for a move back up to the swing high at $167 and beyond.

CAD/JPY 4-hour Forex Chart by TradingView
Next up is this neat range setup on the 4-hour time frame of CAD/JPY.
The pair is closing in on the resistance at the 100.50 minor psychological mark, and it looks like technical indicators are hinting at another move down.
For one, the 100 SMA is still below the 200 SMA to signal that the range resistance is more likely to hold than to break.
Also, Stochastic has been indicating overbought conditions for quite some time, so price could follow suit as the oscillator heads south.
In that case, this forex pair could soon find its way back down to the range support at the 95.50 minor psychological level or at least until the area of interest around the middle.
Just make sure you check the average volatility of CAD/JPY when setting stops!


Comments are closed.