
Hey there, trading aficionados! Today, we’re diving into the world of forex with EUR/CAD as our star of the show!
So, let’s roll up our sleeves and dissect the price action on the 1-hour chart, where things have been quite interesting for the pair in September.

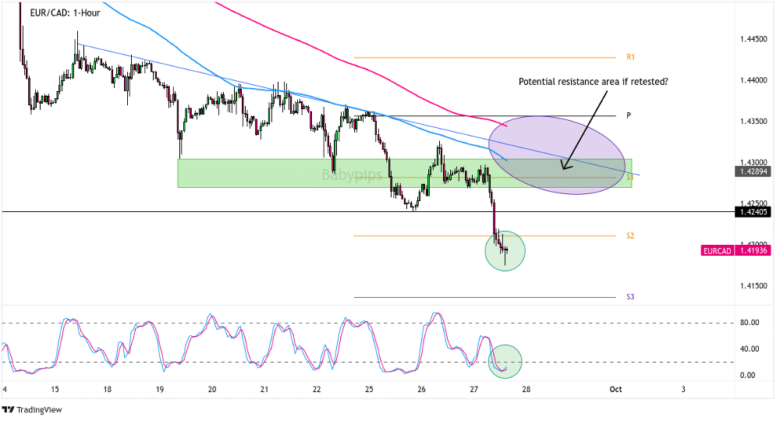
EUR/CAD: 1-Hour Forex Chart by TradingView
First things first, let’s talk about September’s theme for EUR/CAD: the strong downtrend. It’s like the currency pair decided to embrace the autumn blues a little too enthusiastically. Picture leaves falling, the wind blowing, and the price chart heading south without a care.
But wait, there’s more to the story when we zoom in on that 1-hour chart above. We’ve got ourselves a classic case of lower “highs” and a somewhat dirty pattern of lower “lows,” signaling an orderly battle between the bulls and bears, with the bears taking more control with each step lower.
We’ve marked a strong area of interest between 1.4300 – 1.4370 as well. This is where EUR/CAD first found significant support before reluctantly succumbing to the gravitational pull of the downward trend. This turned the 1.4300 major psychological handle into a major resistance area, characterized by today’s strong resistance then spike lower from that area.
The market seems to have stabilized at the moment, and this is where it gets interesting for the few who are still bullish on the pair. The stochastic indicator is flashing a potentially oversold conditions, and we’ve got the early stages of a bullish reversal pattern potentially in the works with a doji candle just forming. It’s like spotting a sprout in the middle of a concrete jungle.
Now, before you get too excited, remember we’re swimming against the current here. The strong downtrend has its hooks in deep. Looking for a long play probably only makes sense for you countertrend scalpers out there, and if that’s you this might be your chance to snatch a few pips. Just keep in mind that this is currently a high risk, low probability setup without a major bullish fundamental catalyst. You’ve been warned.
For those with a bearish outlook, keep your eyes on the confluence of that major area of interest we mentioned earlier. Pair it up with the falling moving averages and the descending “highs” trendline, and now this is an area that may draw in all types of technical sellers, along with potential fundamental sellers looking to get in at slightly better prices.
But hold onto your hats, bulls, because there’s a glimmer of hope for a potential longer-term setup. If EUR/CAD sustains a break above this technical confluence zone, and it’s accompanied by a change in overall market sentiment or some surprising news from the Eurozone or Canada, we might just see the start of a bullish turnaround. Again, not the most ideal setup but it’s definitely something to watch out for.
In the unpredictable world of forex, every twist and turn offers a chance for traders to make their mark. So, whether you’re a bullish optimist or a bearish realist, keep an eye on EUR/CAD, for this September saga is far from over!
Which way are you leaning on EUR/CAD? Let us know in the comment boxes below, and no matter how you decide to trade the markets, remember that risk management always comes first!
Comments are closed.