
The U.S. dollar is way off its monthly lows!
Is it now time for the bears to rain on the bulls’ parade?
Or can the Greenback keep its momentum and hit higher areas of interest?

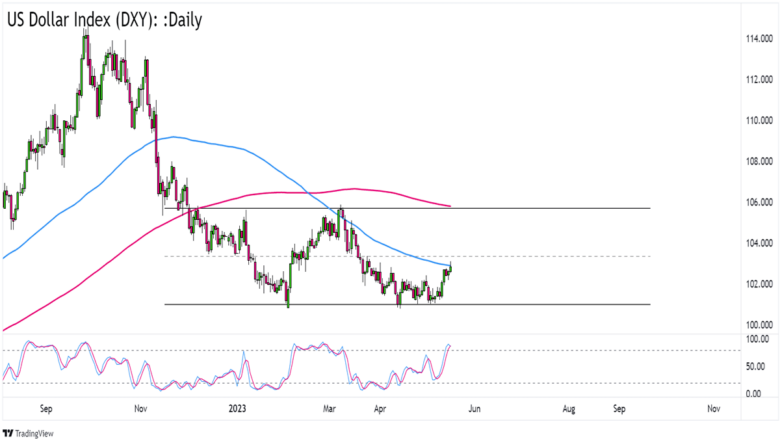
U.S. Dollar Index (DXY) Daily ForexChart by TV
As you can see, the U.S. dollar index (DXY) is trading above the 102.00 psychological handle after weeks of hanging around 101.20 April lows.
Can dollar bulls sustain their momentum?
It would be a challenge with the 100 SMA already testing the dollar’s buying demand.
It also doesn’t help that DXY is already nearing the 103.40 mid-range zone while Stochastic is showing an “overbought” signal on the daily time frame.
Bulls who are confident that the dollar can bust through the 100 SMA and mid-range resistance can take advantage of the current momentum and aim for areas of interest like 103.60 or 104.40.
Feel like the dollar is due for some losses?
Watch out for a rejection at the 100 SMA and 103.50 which opens the index to a trip back down to its 102.20 or even 101.20 previous lows.
Whichever bias you end up trading, make sure to follow your trading plan and to use your best risk management moves so you can trade for another day!
Comments are closed.