Chart Art: Make or Break Trend Levels for EUR/USD and the U.S. Dollar Index (DXY)
Do you prefer trading trends that are your friend?
Or trends that look like they’re about to bend?
Either way, I got you covered with 1-hour trend setups on EUR/USD and the U.S. dollar index (DXY)!

EUR/USD 1-hour Forex Chart by TradingView
The euro has been making pips rain against the dollar since mid-March when the pair bounced from the 1.0530 support.
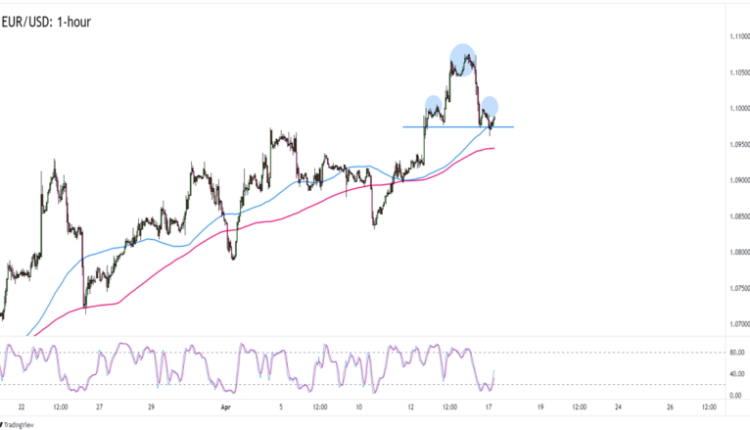
But EUR/USD is sporting what looks like a Head and Shoulders pattern on the 1-hour time frame after getting rejected at the 1.1075 resistance TWICE last week.
Is the party over for the bulls?
The SMAs keeping their bullish tilt and the 100 SMA widening its gap against the slower 200 SMA says “maybe not.”
Until we see a clear breakout below the Head and Shoulders “neckline,” or until EUR/USD firmly trades below the SMAs, EUR/USD could extend its uptrend.
Look out for a bounce that could take EUR/USD back to its 1.1075 April highs.
Of course, if EUR/USD does break below the technical support levels that we’ve identified, then you should keep close tabs on inflection points like 1.0925 or 1.0880 as potential targets.

U.S. Dollar Index (DXY) 1-Hour Forex Chart by TradingView
Can’t get enough of the U.S. dollar? Why not trade the index?
DXY hit a bottom at 100.75 last Friday before dollar bulls flexed their muscles and pushed the index back up to the 101.50 area.
Before you buy USD like global superpowers aren’t after its destruction, however, you should note that DXY is having trouble maintaining its bullish momentum.
Specifically, DXY can’t seem to get past the 50% Fibonacci retracement level from last week’s downswing.
Can’t really blame USD bears since the 50% Fib also lines up with a mid-channel resistance AND the 100 and 200 SMAs on the 1-hour time frame.
A rejection at the 50% Fib opens DXY to a trip back to last week’s lows below 101.00.
If you’re not comfortable selling the dollar without confirmation, then you can also wait for a couple more bearish candlesticks or new daily lows before you aim for the previous lows.


Comments are closed.