Chart Art: Is the Dollar Index (DXY) Returning to Its Downtrend?
The U.S. dollar index is knocking on a couple of major resistance indicators!
Will this lead to DXY extending its 2023 downtrend?
Let me show you what’s cookin’ on the daily time frame:

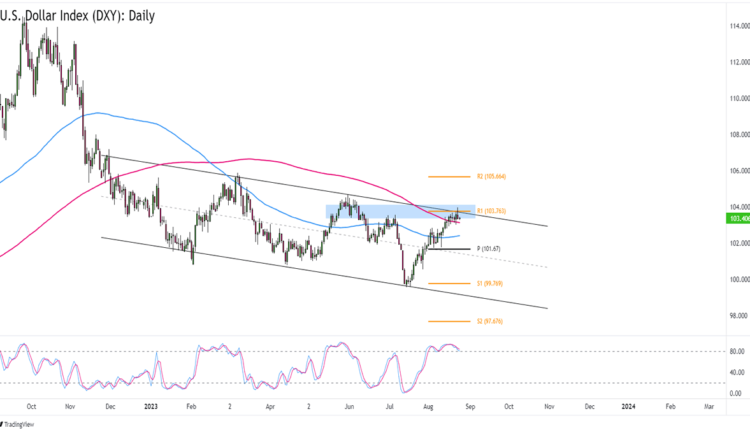
U.S. Dollar Index (DXY) Daily Forex Chart by TV
If you’ve been watching the U.S. dollar index, then you’ll know that DXY has been consolidating at the 103.50 area since reaching the area last week.
And why not? Not only is 103.50 close to the R1 Pivot Point level on the daily time frame, but it’s also near the chart’s 200 SMA.
More importantly, DXY’s current levels line up with the top of a descending channel that’s been solid since late December.
Is the U.S. dollar in for more losses?
It’s definitely an option especially if DXY gets rejected from its current levels.
Look out for a move below the 102.80 or 102.00 areas of interest as it could open up downswings that could reach the 100.00 psychological handle.
Of course, if you’d rather keep on buying the Greenback, then you can also bet on an upside breakout.
A long trade above the channel and the R1 resistance zone, for example, could work if there’s sustained buying pressure above the 104.00 previous high.
What do you think? Can DXY extend its 2023 downtrend in the next couple of days?


Comments are closed.