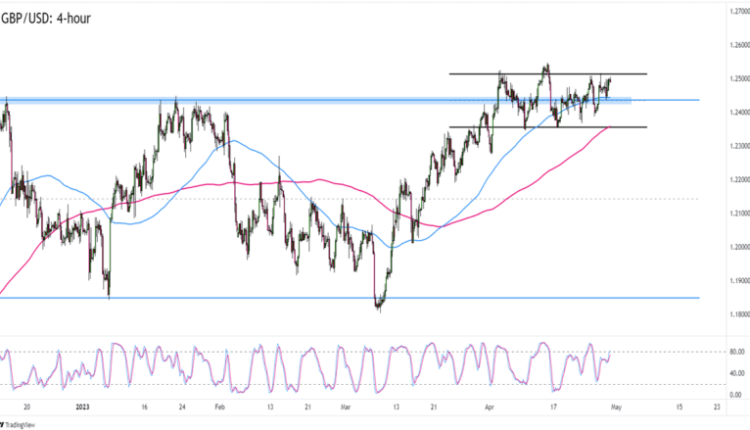
Chart Art: GBP/USD’s Short and Long-Term Range
Cable is struggling to find a new direction after breaking a key resistance level.
Which way will GBP/USD go?
Check out this 4-hour chart!

GBP/USD 4-hour Forex Chart by TradingView
Cable has had a good couple of weeks, rising from its 1.1820 March lows to trade at its current 1.2490 levels.
In fact, GBP/USD’s uptrend has taken the pair past the 1.2450 resistance that led to 600-pip downswings back in December and in early 2023.
Now that GBP/USD has passed the resistance, is it ready to make new 2023 highs?
April’s range is giving “not so fast” vibes.
Watch the 1.2525 short-term range resistance closely to see if it would hold for another day.
A rejection at the level opens GBP to a move back to the 1.2425 mid-range zone or the 1.2350 range support level near the 4-hour chart’s 200 SMA. We could even see GBP/USD return to its multi-month range!
But what if GBP/USD breaks above April’s range resistance?
A clear break above the range could push GBP/USD back to the 1.2600 or 1.2650 previous inflection points.
Whichever direction you choose to trade, make sure to have trading plans ready and to practice your best risk management moves!


Comments are closed.