
This pound pair looks ready to bounce off its long-term range support again!
How high can it go this time?
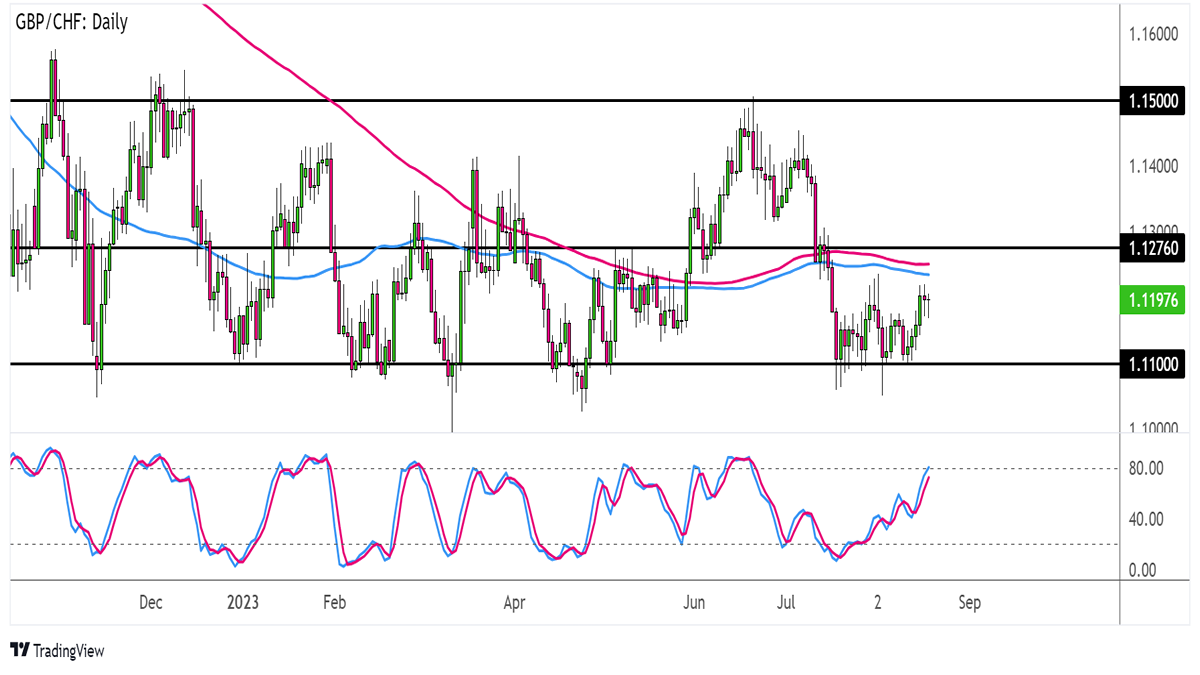
On the daily chart below, you can see that GBP/CHF is trading between support at the 1.1100 major psychological mark and resistance at 1.1500.

GBP/CHF Daily Forex Chart by TV
The pair seems to have formed a short-term double bottom reversal pattern after testing the range support, suggesting that a rally could follow from here.
In that case, GBP/CHF could set its sights back on the very top of the range or at least until the area of interest at the middle.
This happens to be right around the dynamic inflection points at the moving averages, too!
The 100 SMA is below the 200 SMA to suggest that the path of least resistance is to the downside or that the upside barriers are more likely to hold than to break. If so, we might just see another dip back to the range support soon.
Besides, Stochastic is closing in on the overbought region to reflect exhaustion among buyers, so heading south would confirm a return in bearish momentum.
Just make sure you keep an eye out for the U.K. retail sales report due later today, as this might provide more context on whether or not the consumer sector is reeling from stronger-than-expected price pressures.
Robust consumer spending data could reassure pound bulls that overall economic activity could stay supported, even with the possibility of another BOE hike on the horizon.
Do you think GBP/CHF can make it to the range resistance if that happens?
Comments are closed.