Chart Art: Double Bottom Reversal in the Works for USD/CHF?
Looking for more ways to trade the U.S. dollar?
We’re keeping close tabs on a possible reversal for USD/CHF.
Check out this 4-hour chart:

USD/CHF 4-Hour Forex Chart by TradingView
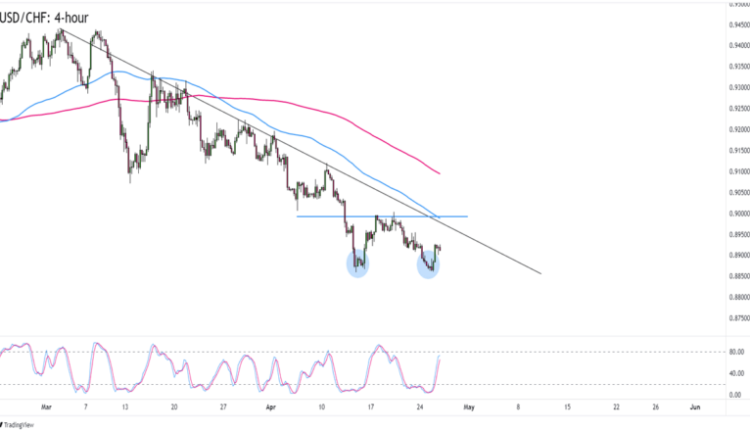
USD/CHF has been showing lower highs and lower lows, falling from a high of .9440 in early March to its current .8900 prices.
What makes the pair interesting today is that it’s showing a Double Bottom pattern on the 4-hour time frame.
More importantly, the pattern’s “neckline” lines up with a trend line and 100 SMA resistance on the chart.
Will USD/CHF extend its weeks-long downtrend?
Or will USD see enough demand to finally see a bullish reversal?
This week’s U.S. GDP and core CPI reports could factor in USD/CHF’s next direction.
Don’t worry, USD/CHF is still about 100 pips away from its make-or-break point near the .9000 psychological level so y’all still have time to whip up a trading plan.
A rejection at the .8970 – .9000 zone opens USD/CHF to further downside action and possibly new April lows.
But if USD/CHF starts to trade and maintain its levels above the Double Bottom neckline, then the pair could revisit previous inflection points near .9040, .9090, or .9120.


Comments are closed.