Chart Art: Consolidation-Breakout Setup on GBP/AUD?
We’re staying focused on AUD charts ahead a major economic update from Australia, and this time we’re looking at the downtrend in GBP/AUD.
Will the consolidation pattern break to the downside? Or are we looking at a potential reversal in the making on an upside break?

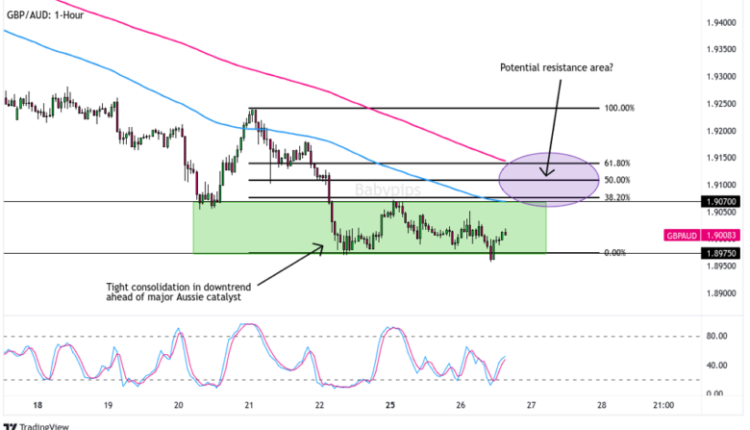
GBP/AUD 1-Hour Forex Chart by TradingView
G’day, fellow traders! Today, we’re checking out GBP/AUD as volatility is on the horizon for the Australian dollar.
Why, you ask? Well, there’s an impending update in inflation data from the Land Down Under. You know how they say, “When it rains, it pours,” and in the world of Forex, when data drops, volatility often follows suit. And markets with tight price action like what we currently see in GBP/AUD sometimes proceeds breakout moves!
On the one hour chart above, we can see that traders are currently playing a game of cat and mouse within a range of 1.8975 – 1.9070. It’s like watching a tennis match where neither player wants to give an inch. But eventually, one player will gain the upper hand and and likely take control of the market’s next move.
So, if the upcoming Australian CPI update sparks a bearish frenzy for the Aussie, our dear GBP/AUD might just break free from this consolidation area to the upside. However, there’s a twist in the tale—there’s a whole circus of technical factors that could potentially pull in sellers above current market prices. We’re talking about falling moving averages, Fibonacci retracement levels, and the unyielding grip of the downtrend itself. It’s like trying to escape a spider’s web while holding a bungee cord.
For all you GBP/AUD bulls out there dreaming of a breakout to the heavens, take a moment to consider these factors before working on your risk management plan.
If you’re looking for a better potential risk-to-reward ratio for a long position, though, then the 1.8975 support area is a better area to watch if the market is trading there before the CPI event. Bullish reversal patterns there may be the signal that pulls in buyers in the short-term.
Now, let’s talk about the flip side of the coin. If the Australian CPI update decides to spark bullish moves for the Aussie, GBP/AUD bears might just find their moment in the spotlight.
First, keep your telescopes trained on that confluence area where moving averages and Fibonacci retracement levels intersect. If the market is trading there around the event, then look out for bearish reversal patterns before considering hopping back on the trend’s downward slide.
But wait, there’s more! If GBP/AUD decides to break through the area of interest around 1.8975, we might see a parade of technical sellers marching in. And if the Australian CPI update turns out to be a real blockbuster hit, much stronger than expected, fundamental sellers might just join the party. It’s like a crowd rushing to catch the last train home when the station is about to close.
With a daily average true range of around 130 pips, a move to the 1.8900 handle and beyond is not out of the realm of possibilities, especially when considering the big downtrend the pair is already in!
Which way are you leaning on GBP/AUD? Let us know in the comment boxes below, and no matter how you decide to trade the markets, remember that risk management always comes first!


Comments are closed.