Chart Art: Bitcoin’s (BTC/USD) Trend Pullback Trade
Looking for another chance to short bitcoin (BTC/USD) this week?
I gotchu!
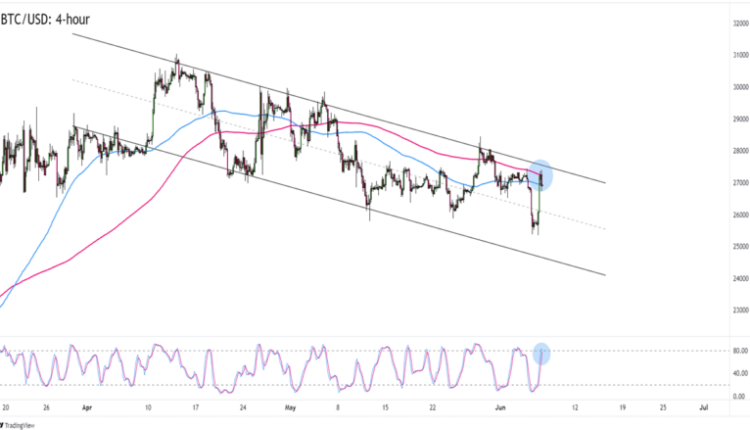
BTC/USD is testing a dynamic resistance zone that just might lead to a bearish momentum for the OG crypto.

Bitcoin (BTC/USD) 4-hour Chart by TV
Just over a week ago, we talked about BTC/USD hitting the resistance of a descending channel pattern.
Fast forward to today and the pair had retested May’s lows…but has come back up again.
Is this another opportunity to short bitcoin?
BTC/USD is having trouble getting sustained demand above the $27,000 mark, which isn’t surprising since the 100 and 200 SMAs are also around the psychological level.
In fact, $27K is also not far from the trend line that held as resistance last week!
Add to that an (almost) overbought Stochastic signal and you’ve got a recipe for a potential bearish swing.
BTC/USD sellers who are confident that the pair would make new monthly lows can short at current levels and place stops just above the $28,500 swing high.
If you think the third successful defense of the $26,000 is a sign of a bottom, you can also consider buying BTC/USD instead.
Just make sure to do it above the resistance zone that we’ve marked so you have additional confirmation of a bullish breakout!
This content is strictly for informational purposes only and does not constitute as investment advice. Trading any financial market involves risk. Please read our Risk Disclosure to make sure you understand the risks involved.


Comments are closed.