Chart Art: Bitcoin (BTC/USD)’s Potential Reversal and USD/JPY’s Pullback Trade
It’s February 14 and you know what that means – we’re halfway through the month!
Give your P&L a mid-month boost by taking advantage of Bitcoin showing a potential reversal pattern while USD/JPY heads for a pullback zone.
Check them out!

Bitcoin (BTC/USD) 4-hour Forex Chart by TradingView
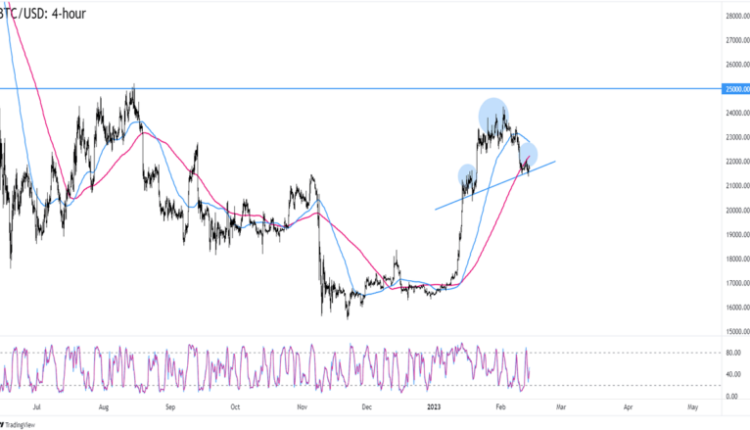
Just when it looked like Bitcoin was headed for its August 2022 highs, BTC/USD found enough sellers at 24,300 and now the pair is trading under 22,000.
Will the rejection at 24,000 lead to a bearish reversal?
BTC/USD is forming a possible Head and Shoulders pattern on the 4-hour time frame. Meanwhile, the 100 SMA is closing its gap with the longer-term 200 SMA.
A dip below the Head and Shoulders “neckline” could drag BTC/USD to previous areas of interest like 20,400 or 18,300.
But if Bitcoin bounces from the 200 SMA and its neckline support, then we could see BTC/USD retest its 23,00 – 24,000 previous highs.

USD/JPY Daily Forex Chart by TradingView
In case you missed it, USD/JPY has been making higher highs and higher lows since mid-January when it hit bottom at 127.50.
I’m taking a closer look at the daily time frame today because USD/JPY is nearing an inflection point that served as resistance in July and in December.
This time around, the 136.00 – 136.00 potential resistance zone lines up with the 38.2% Fibonacci retracement of the last major downswing.
What’s more, it’s also near the daily chart’s 100 and 200 SMAs that may soon show a bearish crossover.
But 136.00 is still hundreds of pips away.
Y’all still have time to consider alternate scenarios in your trading plan if you’re thinking of trading USD/JPY’s pullback!


Comments are closed.