
Do you prefer going with the flow and following trends?
Or are you feeling gutsy enough to take a contrarian setup?
Either way, I’ve got you covered with these setups on AUD/USD and EUR/NZD.

AUD/USD 4-hour Forex Chart by TradingView
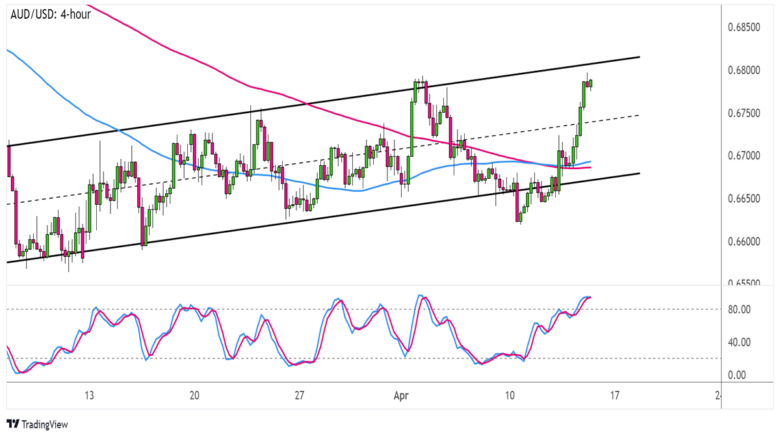
Check out these higher lows and higher highs inside AUD/USD’s channel!
The pair is closing in on the resistance, so will the rally be cut short soon?
Stochastic seems to think so, as the oscillator is already in the overbought zone to reflect exhaustion among sellers. Turning lower would confirm that bearish vibes are returning and might lead to a dip back to nearby support zones.
Aussie bears could aim for the bottom of the channel at the .6700 handle or be quick to book profits at the mid-channel area of interest.
After all, the 100 SMA just crossed above the 200 SMA to indicate that the path of least resistance is to the upside or that there’s a good chance support levels might still hold.

EUR/NZD 4-hour Forex Chart by TradingView
Next up is this neat retracement setup on the 4-hour chart of EUR/NZD.
The pair is also in the middle of an uptrend and seems ready to dip back to support. Will buyers defend the floor?
Technical indicators are pointing to the presence of bullish energy, as the 100 SMA is safely above the 200 SMA while Stochastic is close to reflecting oversold conditions.
But before the oscillator pulls any higher, we might just see a dip to the area of interest close to the 1.7400 handle, trend line, 100 SMA dynamic support, and 61.8% Fibonacci retracement level.
Talk about confluence, baby!
A shallow correction might already find buyers at these current levels at the 38.2% Fib, though, so watch out for a move back to the swing high if euro bulls are eager to charge.
Comments are closed.