

USD/CAD ANLAYSIS
- Canada’s inflation report aided the loonie against the USD.
- Chinese GDP endorsed the crude oil rally, leaving the CAD bid for most of the European session.
- Key technical zone being tested with breakout potential.
Trade Smarter – Sign up for the DailyFX Newsletter
Receive timely and compelling market commentary from the DailyFX team
Subscribe to Newsletter
USD/CAD FUNDAMENTAL BACKDROP
The Canadian dollar rallied on the back of an overall positive Chinese GDP print earlier this morning that stoked bulls to get behind global commodities including crude oil. Both WTI and Brent crude oil are trading higher today as demand-side factors improve. That being said, global recessionary fears could minimize the impact of the Chinese data with global demand faltering, the remains, can the Chinese economy maintain its post-COVID growth statistics?
Canadian inflation (refer to economic calendar below) data showed signs of continued decline despite the marginal beat on MoM core inflation. I don’t believe this is enough to deter the current monetary policy stance from the Bank of Canada (BoC) in pausing their interest rate cycle at 15-year highs (4.5%). From a US perspective, building permit data suggests a further slump in the US housing market, adding pressure to the USD selloff today ahead of the US trading session. While the Fed is still likely to hike by 25bps in May, there accumulating data points in favor of a slowing economy possibly indicative of the Fed nearing its peak.
Recommended by Warren Venketas
Get Your Free USD Forecast
USD/CAD ECONOMIC CALENDAR
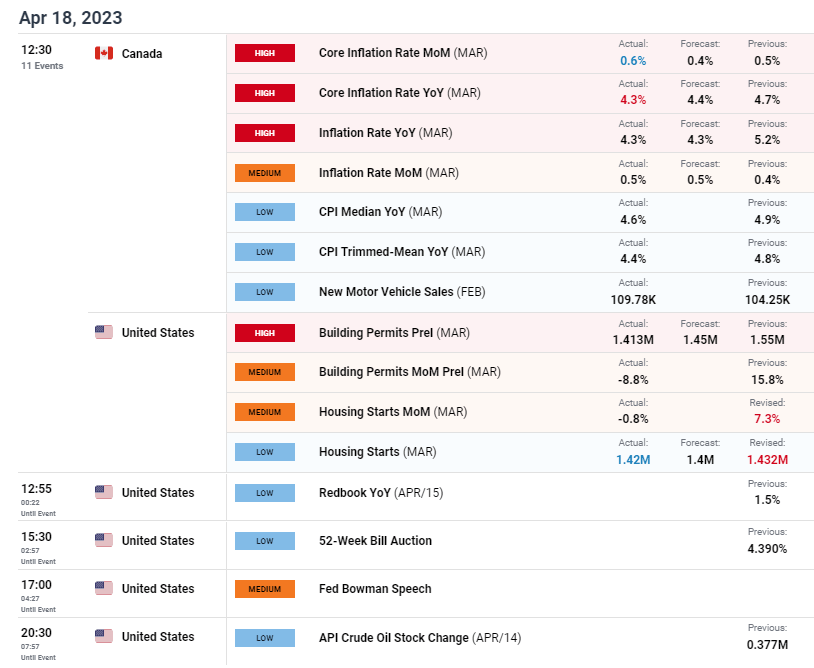
Source: DailyFX Economic Calendar
Later today, the Fed’s Bowman will come into focus (possibly adding to the Fed's Bullard's recent hawkish comments) while the weekly API crude oil report that has been showing signs of increasing inventory could mute CAD gains should this week’s figure follow suit.
TECHNICAL ANALYSIS
USD/CAD DAILY CHART
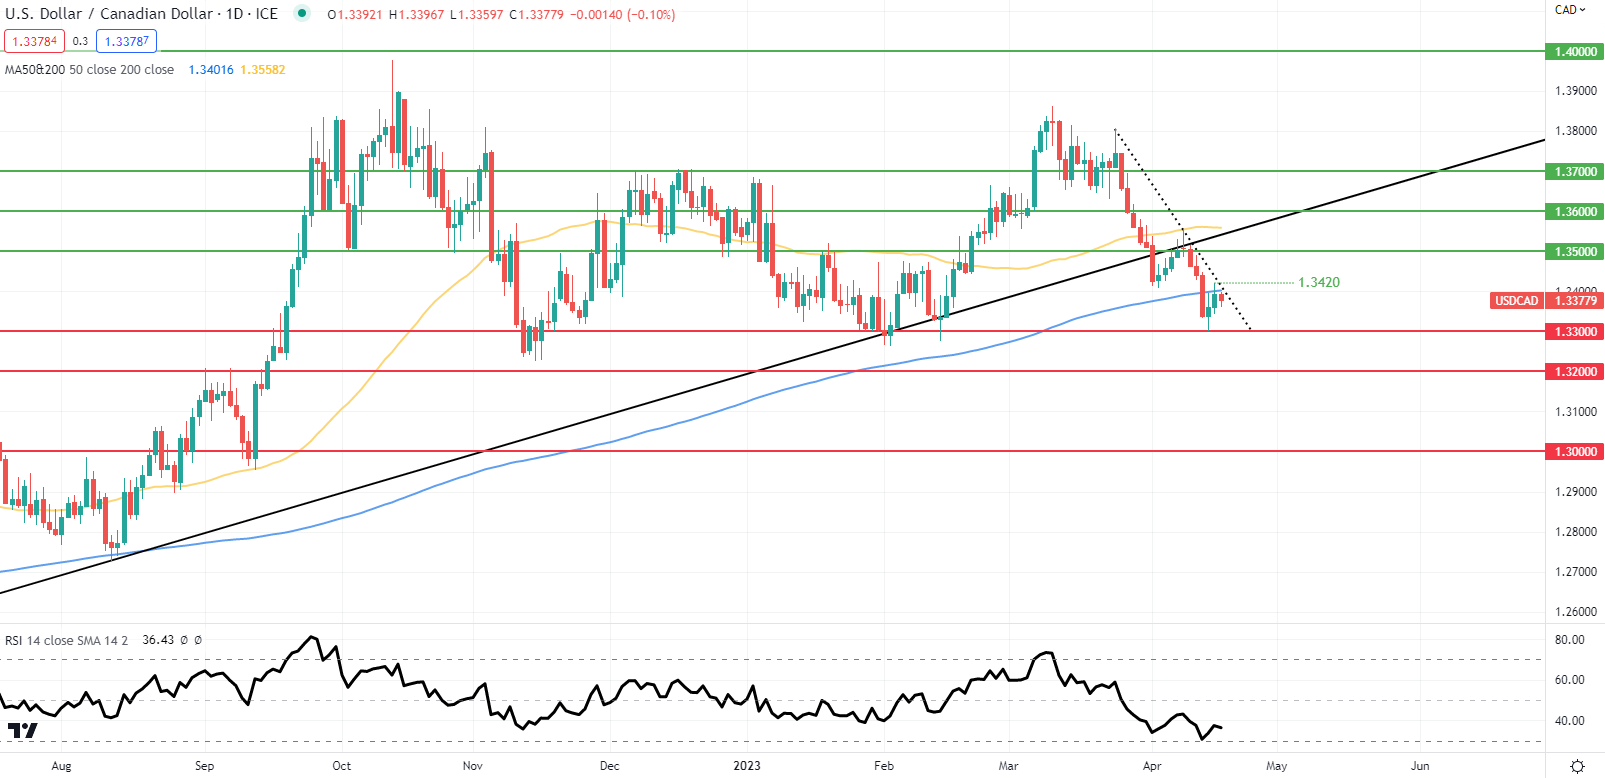
Chart prepared by Warren Venketas, IG
Daily USD/CAD price action has showed bulls determination to defend the 1.3300 psychological support handle but now comes a key resistance test at a major area of confluence including the 200-day moving average (blue) and the medium-term trendline support (dotted black line). A successful daily close above the major zones could USD/CAD claw its way out of oversold territory as measured by the Relative Strength Index (RSI) up towards subsequent resistance zones.
Key resistance levels:
- 1.3420
- 200-da MA/Trendline resistance
Key support levels:
IG CLIENT SENTIMENT DATA: MIXED
IGCS shows retail traders are currently LONG on USD/CAD , with 62% of traders currently holding long positions (as of this writing). At DailyFX we typically take a contrarian view to crowd sentiment but due to recent changes in long and short positioning we arrive at a short-term cautious disposition.
Contact and followWarrenon Twitter:@WVenketas
Comments are closed.