Caixin Services Beats Expectations; Shanghai Composite and Hang Seng to Gain??
HANG SENG, SHANGHAI COMPOSITE, HSI – Technical Outlook:
- China Caixin PMI services beat expectations.
- The Shanghai Composite Index and the Hang Seng Index are testing key resistance.
- What is the outlook and what are the key levels to watch?
Recommended by Manish Jaradi
How to Trade the “One Glance” Indicator, Ichimoku
Stronger-than-expected Caixin services activity data bodes well for China’s growth outlook as the Shanghai Composite index and the Hang Seng index test key resistance.
China Caixin PMI services rose to 57.8 in March, vs 55 expected, up from 55 in February as the economy reopening gathers steam. This follows upbeat official non-manufacturing PMI data published last week. Broadly, China's macro data have beaten expectations, as reflected in the Economic Surprise Index for China (at the highest level at least since 2014). In addition, hopes of a turnaround in the property cycle and hopes that regulatory crackdown on corporates could be ending suggest the growth spurt could turn out to be more than temporary.
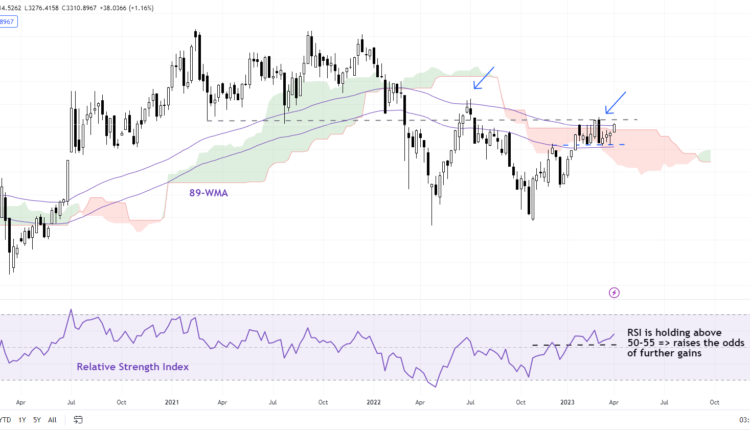
Shanghai Composite Index Weekly Chart
Chart Created Using TradingView
Upbeat data has translated into sharp upward revisions to China’s economic growth outlook since the beginning of the year – consensus now expects about 5.3% on-year growth for China for the year 2023, up sharply from around 4.3% in January.
Shanghai Composite Index Daily Chart

Chart Created Using TradingView
Shanghai Composite Index: Tests a vital barrier
The Shanghai Composite Index has been in a narrow range since the start of the year. The lower edge of the range is defined by a horizontal line from February (at about 3215), while the upper end of the range is around the early-March high of 3343. Any break above 3343 could initially open the door for a rise toward the mid-2022 high of 3425. On the other hand, there is plenty of support on the downside below 3215, including the 89-day moving average, the 200-DMA, and the lower edge of the Ichimoku cloud on the daily charts.
Hang Seng Index Weekly Chart
Chart Created Using TradingView
Hang Seng: Range likely
The Hang Seng Index’s hold above vital support at the December low of 18885 confirms that the higher-top-higher-bottom sequence from the end of 2022 remains in place. It is now approaching a key ceiling at the early-March high of 21005. However, given the overhang of the big bear market since 2018, the index may not turn unambiguously bullish soon. That is, it could settle in a range in the interim. The lower end of the range is 18400-18900 (including the mid-November high of 18415), while the upper end of the range would likely be by the January high of 22700.
Hang Seng Index Daily Chart

Chart Created Using TradingView
Trade Smarter – Sign up for the DailyFX Newsletter
Receive timely and compelling market commentary from the DailyFX team
Subscribe to Newsletter
— Written by Manish Jaradi, Strategist for DailyFX.com
— Contact and follow Jaradi on Twitter: @JaradiManish


Comments are closed.