Bullish above 0.6650 amid firmer Aussie Retail Sales, pre-Fed USD fall
- AUD/USD clings to mild gains inside weekly bullish channel, keep bounce off 200-EMA.
- Easing bearish bias of MACD signals adds strength to recovery moves.
- Three-week-old descending trend line acts as immediate hurdle; downside break of 0.6650 can prod yearly low.
AUD/USD remains mildly bid during a three-day winning streak around 0.6665 heading into Wednesday’s European session.
Also read: AUD/USD remains confined below 0.6670 despite upbeat Australian Retail Sales data
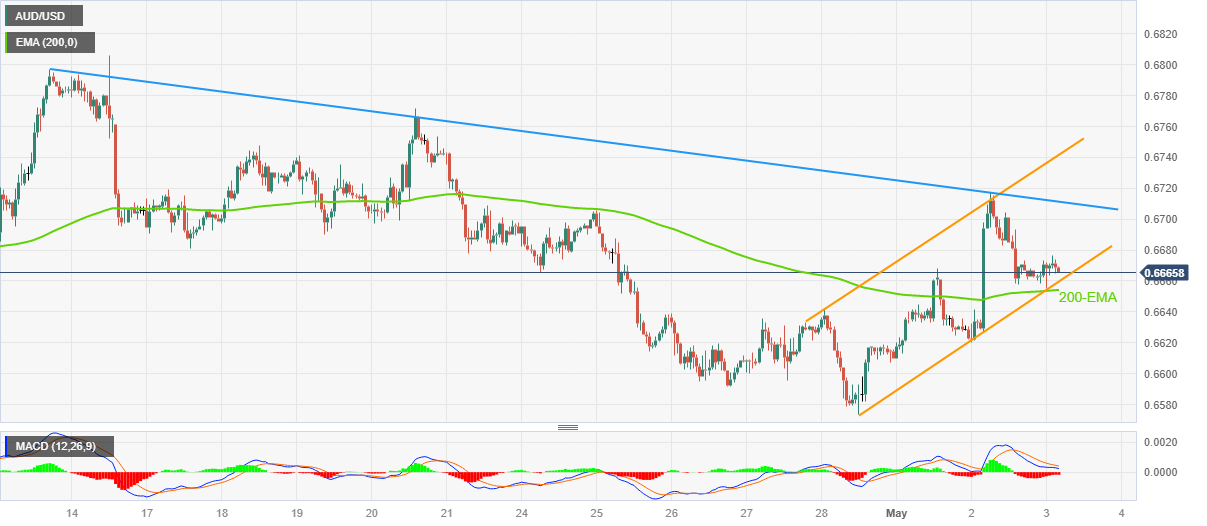
In doing so, the Aussie pair stays within an upward-sloping trend channel while defending the previous day’s rebound from the 200-hour Exponential Moving Average (200-EMA).
That said, the easing bearish bias of the MACD signals and the pair’s sustained trading inside a bullish chart formation, not to forget the clear bounce off 200-EMA, keeps AUD/USD buyers hopeful.
However, the late April swing high near 0.6705 challenges the immediate upside of the Aussie pair, a break of which will highlight a downward-sloping resistance line from April 13, close to 0.6715 at the latest.
In a case where the AUD/USD buyers keep the reins past 0.6715, the stated weekly channel’s top line, near 0.6745 by the press time, as well as the April 25 swing high near 0.6775, could challenge the upside momentum.
On the contrary, a downside break of the stated bullish channel’s support line, near 0.6660, isn’t an open offer for the Aussie bear’s welcome as the 200-EMA level of 0.6650 can prod the AUD/USD pair’s further declines.
Following that, a slump towards the yearly low marked in April, close to 0.6565, can’t be ruled out.
AUD/USD: Hourly chart
Trend: Further upside expected


Comments are closed.