BTC, ETH Held Back by Technical Resistance
Bitcoin (BTC), Ethereum (ETH) Outlook:
- Bitcoin (BTC) eases as bulls strive to breach $25,000.
- Ethereum (ETH) steps back to prior support after failing to hold above $1,700
- Risk assets await FOMC minutes and other key economic data
Recommended by Tammy Da Costa
Get Your Free Bitcoin Forecast
Bitcoin prices have surged over 50% since the start of the year and approximately 6.5% this month. With a 39.93% rally in January allowing BTC to breach $20,000, the speculative asset has continued to climb, rising to another big level of psychological resistance at $25,000.
As the largest digital cryptocurrency (in terms of market cap) strives to hold onto its gains, Ethereum (ETH) prices have lagged, appreciating around 38% in the past two months.
Trading Strategies and Risk Management
Price Action
Recommended by Tammy Da Costa
While the Federal Reserve and other central banks aim to balance recession fears with economic growth, both technical and fundamental factors are weighing on price action.
Although the Fed and ECB have committed to raising interest rates until inflation shows positive signs of returning to the target of 2%, expectations of a potential slowdown in the pace of rate hikes has assisted risk assets.
Bitcoin Price (BTC) Analysis
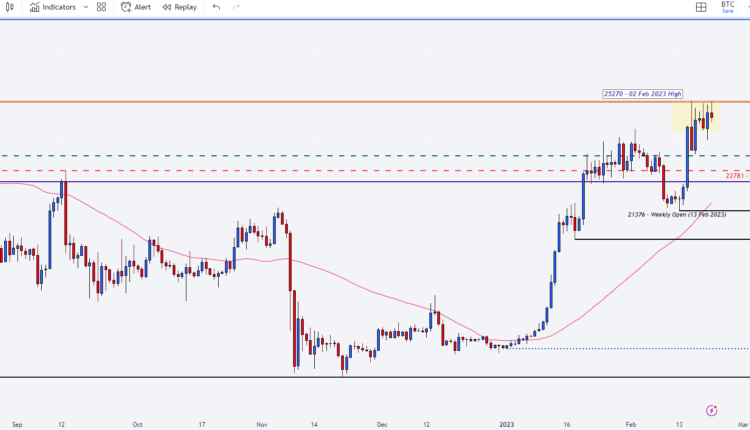
With Bitcoin currently lingering between $24k – $25 250, the August 2022 high has formed an additional layer of resistance at $25 212.
Although price action has slowed over the past few weeks, a hold above $23 000 could continue to support the bullish narrative.
However, if prices dip back below the September high, the risk of prices experiencing an increase in bearish momentum remains firm, opening the door for the September high of $22 781.
Bitcoin Price (BTC/USD Daily) Chart
Chart prepared by Tammy Da Costa using TradingView
Bitcoin (BTC/USD) Key Levels
| Support | Resistance |
|---|---|
| 23,954 (Jan high) | 25,000 (Psychological level) |
| 22,781 (September 2022 High) | 25,212 (August 2022 high) |
| 21,376 (13 Feb open) | 25,401 (May 2022 low) |
Ethereum (ETH) Price Forecast
Meanwhile, Ethereum prices are ranging between the 61.8% Fibonacci of the 2022 move ($1,664.82) & the $1,700. With the November 2022 high forming another barrier of resistance at $1,678.8, bulls may continue to face technical hurdles before obtaining a clear directional bias.
Ethereum Price (ETH/USD Daily) Chart

Chart prepared by Tammy Da Costa using TradingView
Ethereum (ETH/USD) Key Levels
| Support | Resistance |
|---|---|
| 1,664 (Fib support) | 1,678 (November High) |
| 1,600 (Psych level) | 1,700 (Psychological level) |
| 1,517 (Fib level) | 1,742 (Feb ‘23 High) |
Bitcoin Further Reading:
Trade Smarter – Sign up for the DailyFX Newsletter
Receive timely and compelling market commentary from the DailyFX team
Subscribe to Newsletter
— Written by Tammy Da Costa, Analyst for DailyFX.com
Contact and follow Tammy on Twitter: @Tams707


Comments are closed.