Breaks below 0.9400, eyeing a break beneath the 20/50-DMAs
- USD/CHF stumbled below the 100-day EMA, eyeing a break below the 20/50-day EMAs.
- The Relative Strength Index edges down but at the brisk of turning bearish.
- USD/CHF Price Analysis: Failure to crack the 200-day EMA opened the door for further downside.
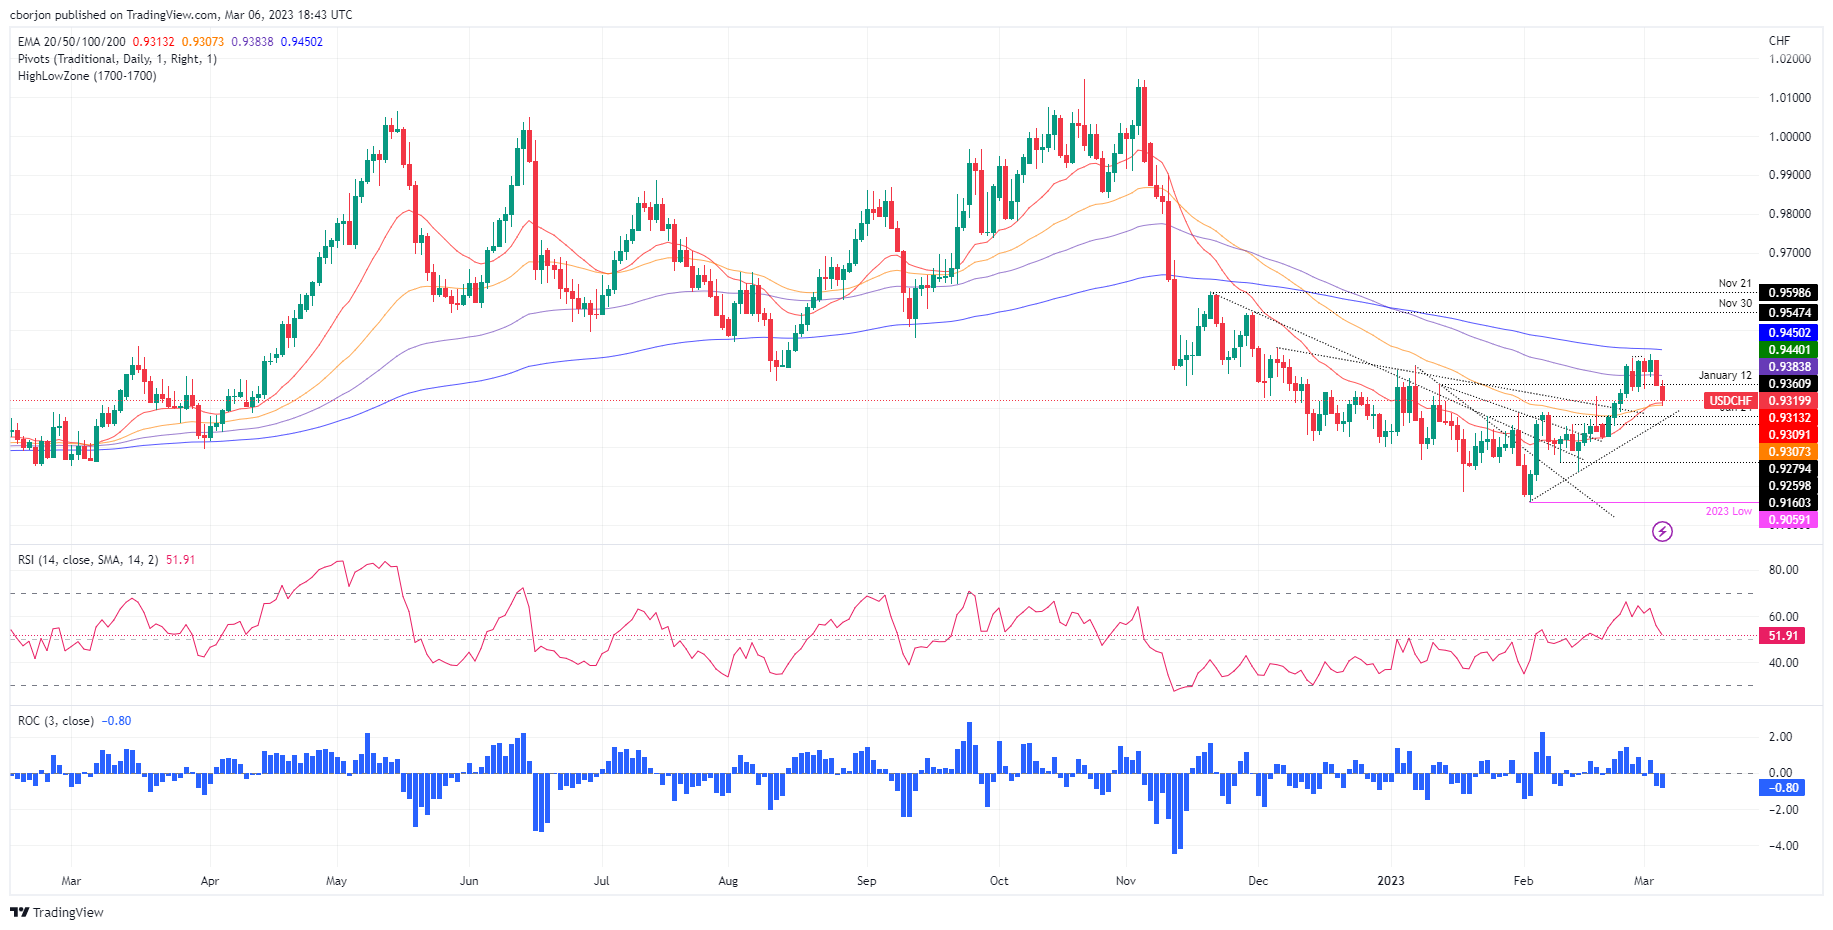
The USD/CHF dropped after failing to test the 200-day Exponential Moving Average (EMA), which extended its losses past the 100-day EMA at 0.9383. the USD/CHF, Monday’s high, was 0.9373 before retracing toward the low of 0.9310s. At the time of writing, the USD/CHF is trading at 0.9317, down 0.44% or 40 pips.
USD/CHF Price action
At the beginning of the first full week in March, the USD/CHF keeps a bearish tone but faces solid support at the confluence of moving averages. The 20 and 50-day EMA rest at 0.9313 and 0.9307, respectively, areas that are the first lines of defense for USD/CHF’s bulls. Break below would expose the 0.9300 psychological price level, ahead of a one-month-old upslope support trendline at 0.9270.
Even though the USD/CHF’s bias is bearish, the Relative Strength Index (RSI) remains bullish but aims lower. If the RSI turns bearish, that will exacerbate an acceleration of the downtrend and put into play the YTD low at 0.9059.
As an alternate scenario, the USD/CHF first resistance would be the 100-day EMA at 0.9383. Break above will expose 0.9400, ahead of the important 200-day EMA At 0.9450, ahead of reaching the psychological 0.9500 mark.
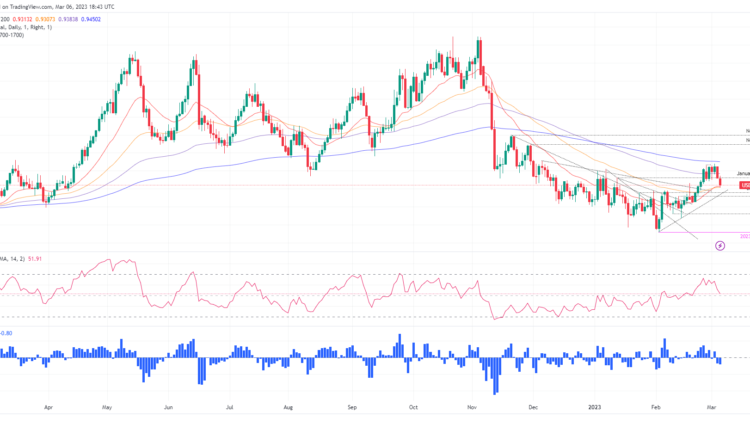
USD/CHF Daily chart
USD/CHF Technical levels


Comments are closed.