

CRUDE OIL PRICES OUTLOOK:
- Crude oil prices have lacked directional conviction after failing to break through confluence resistance last week
- WTI futures have been swinging back and forth between ~$77.50 and ~$74.00 in recent days, awaiting the next market catalysts
- This article looks at oil key technical levels to watch in the coming trading sessions
Recommended by Diego Colman
Get Your Free Oil Forecast
Most Read: Gold Suffers Setback as USD and Yields Blast Off. Will XAU/USD Break Down?
Crude oil as measured by WTI futures has rallied strongly since late June through the first two weeks of this month, but upward momentum has faded after prices failed to break through confluence resistance just above the $77.00 handle, where the 200-day simple moving average coincides with the upper boundary of a medium-term downtrend channel.
The daily chart below shows how the commodity has lacked directional conviction following the recent technical rejection, with prices swinging back and forth between ~$77.50 and ~$74.00.
WTI futures will need to breach the trading range discussed earlier before the next significant move in the energy sector plays out. On that premise, there are two possible tactical scenarios that should be analyzed given current market dynamics.
Recommended by Diego Colman
How to Trade Oil
Scenario 1: Resistance breakout
The 200-day simple moving average, which hovers above the psychological $77.00 mark, along with channel resistance will be a difficult barrier for bulls to overcome. However, in the event of a bullish breakout, buyers could become emboldened to launch an assault on the $79.00 level. On further strength, the focus shifts higher to the $83.00 region, near this year’s peak.
Scenario 2: Support breakdown
Looking at the chart below, support at $74.00 seems more fragile and easier to take out, so bears may have an advantage in terms of regaining the upper hand. That said, if oil manages to slip below $74.00 decisively, selling interest could increase, setting the stage for a move to $72.50. Further losses may be in store on a push below this floor, with the next downside area of interest at $71.85, followed by $70.00.
Recommended by Diego Colman
Improve your trading with IG Client Sentiment Data
CRUDE OIL PRICES TECHNICAL CHART
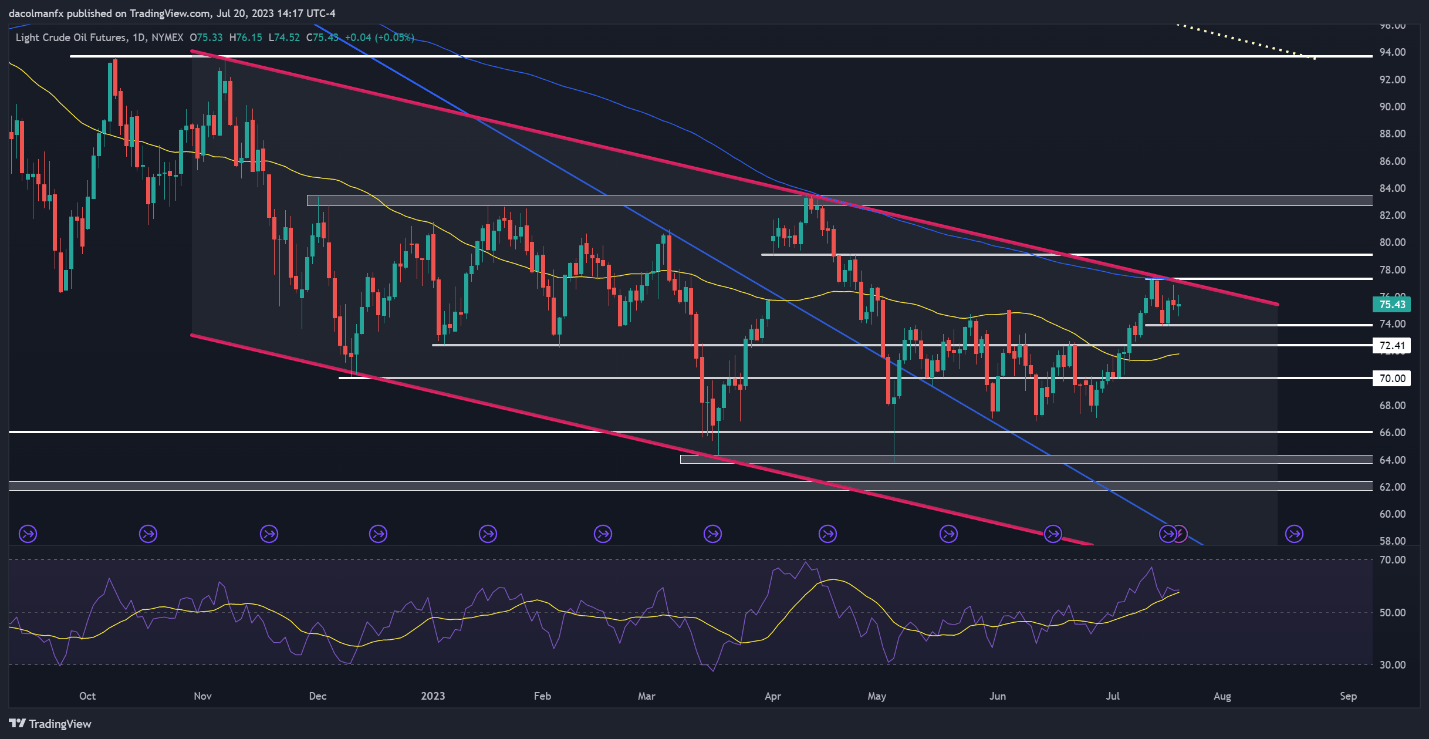
WTI Crude Oil Futures Chart Prepared Using TradingView
Comments are closed.