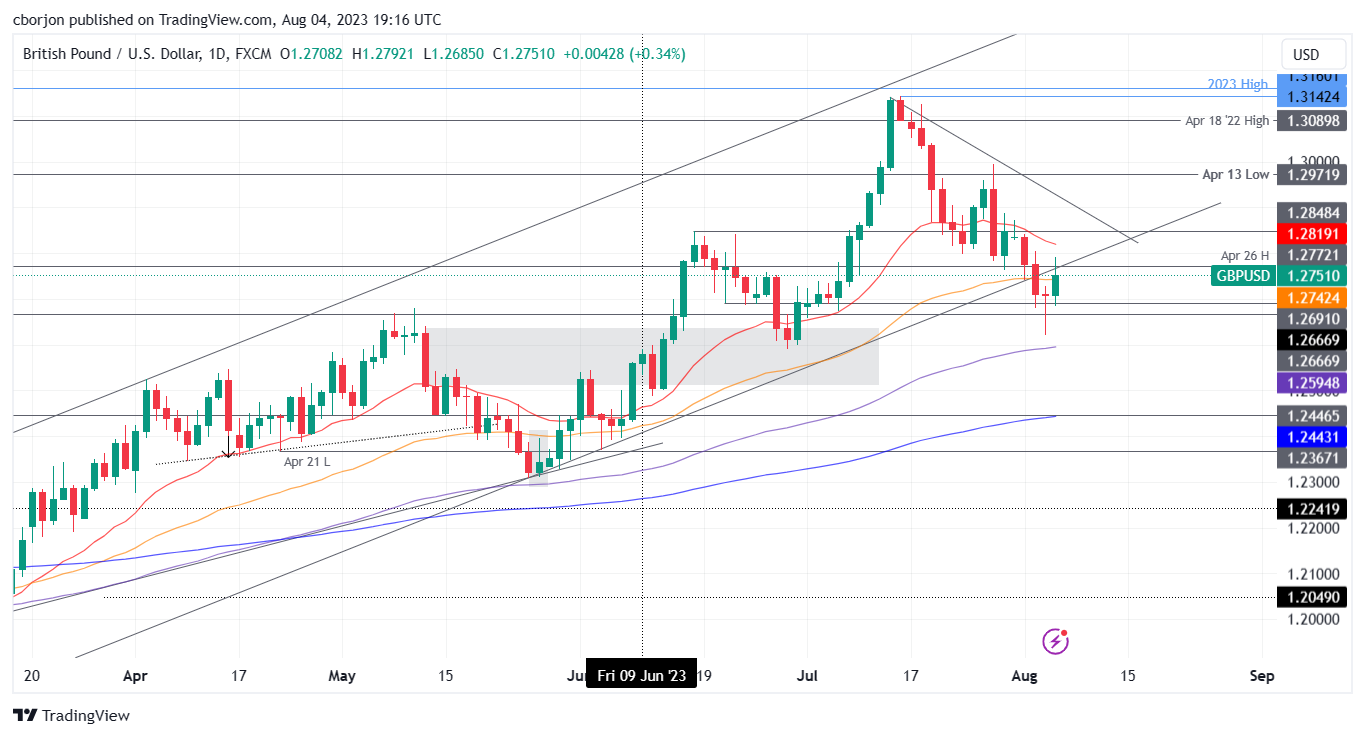
Bounces after printing a doji, as morning-star looms
- GBP/USD rises 0.34%, trading at 1.2755, as soft US jobs data fuels speculation the Fed may end its tightening cycle, providing support to the Sterling.
- Technical analysis indicates potential for short-term gains but highlights the importance of 1.2800 resistance.
- Key support and resistance levels were identified, including 20-day EMA at 1.2819 and 100-day EMA at 1.2595.
GBP/USD registered modest gains on Friday after a soft US jobs data report spurred speculations the US Federal Reserve (Fed) might end its tightening cycle. Nevertheless, failure to crack the 1.2800 figure would likely keep the Sterling (GBP) pressured in the medium term. The GBP/USD trades at 1.2755, a gain of 0.34% at the time of writing.
GBP/USD Price Analysis: Technical outlook
The GBP/USD has been recovering some ground in the last couple of days. Thursday’s price action formed a doji, but Friday’s bullish candlestick remains shy of completing a ‘morning-star’ bullish candlestick pattern, which could indicate further gains in the near term.
The uptrend could resume if GBP/USD achieves a daily close above April 26 daily high at 1.2772, followed by the 1.2800 figure. A breach of the latter will expose the 20-day EMA at 1.2819, followed by the 1.2900 mark. Conversely, the GBP/USD first support would be the 1.2700 figure. The break below will set the stage to test the August 3 daily low of 1.2620, followed by the 100-day Exponential Moving Average (EMA) at 1.2595.
GBP/USD Price Action – Daily chart


Comments are closed.