

Bitcoin, BTC/USD – Technical Outlook:
- Bitcoin rises above the key psychological 30000 level.
- BTC/USD’s trend remains bullish, though some consolidation can’t be ruled out.
- What are the key levels to watch?
Recommended by Manish Jaradi
Get Your Free Introduction To Cryptocurrency Trading
BITCOIN TECHNICAL OUTLOOK – BULLISH
Bitcoin’s jump to a nine-month high is a sign that the medium-term downtrend in cryptocurrencies is changing. While the trend on the daily charts continues to be bullish, some short-term consolidation can’t be ruled out.
BTC/USD has crossed a vital barrier at the March highs of 28920-29175. The break has opened the way initially toward resistance on an uptrend line from January (now at about 30800) followed by the May 2022 high of 32375. From a trend perspective, Bitcoin turned bullish in January – see “Bitcoin Technical Outlook: BTC/USD Turns Bullish”, published January 18. The colour-coded candlestick charts, based on trend/momentum indicators, indicate BTC/USD remains in a bullish phase (see chart).
BTC/USD Daily Chart
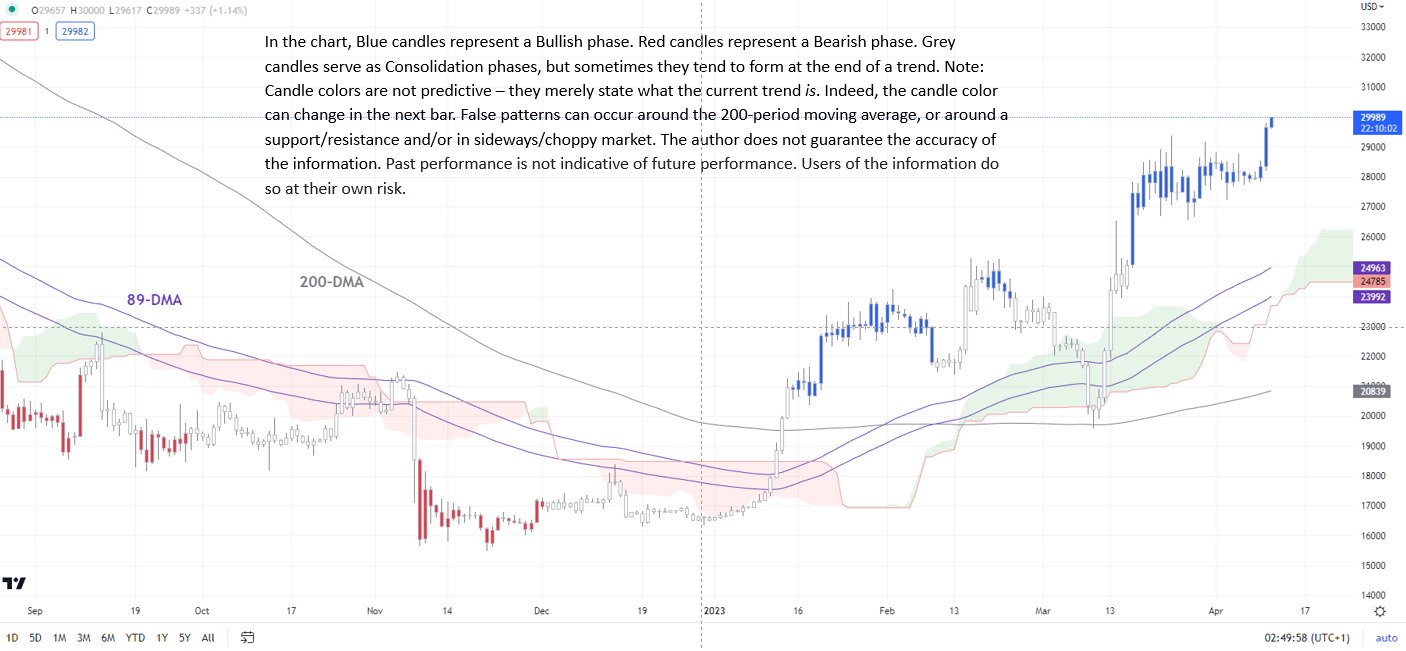
Chart Created by Manish Jaradi Using TradingView
Importantly, the higher-top-higher-bottom sequence forming on the weekly charts indicates that the medium-term downward pressure is easing. This is further reinforced by the rise above the stiff hurdle on the 200-week moving average. For more discussion, see “Bitcoin Technical Outlook: Medium-Term Downward Pressure is Fading”, published March 30.The potential for a base building in cryptocurrencies was first highlighted in November, and the possibility of a reversal in the medium-term downward pressure was subsequentlyhighlighted in January.
BTC/USD Weekly Chart
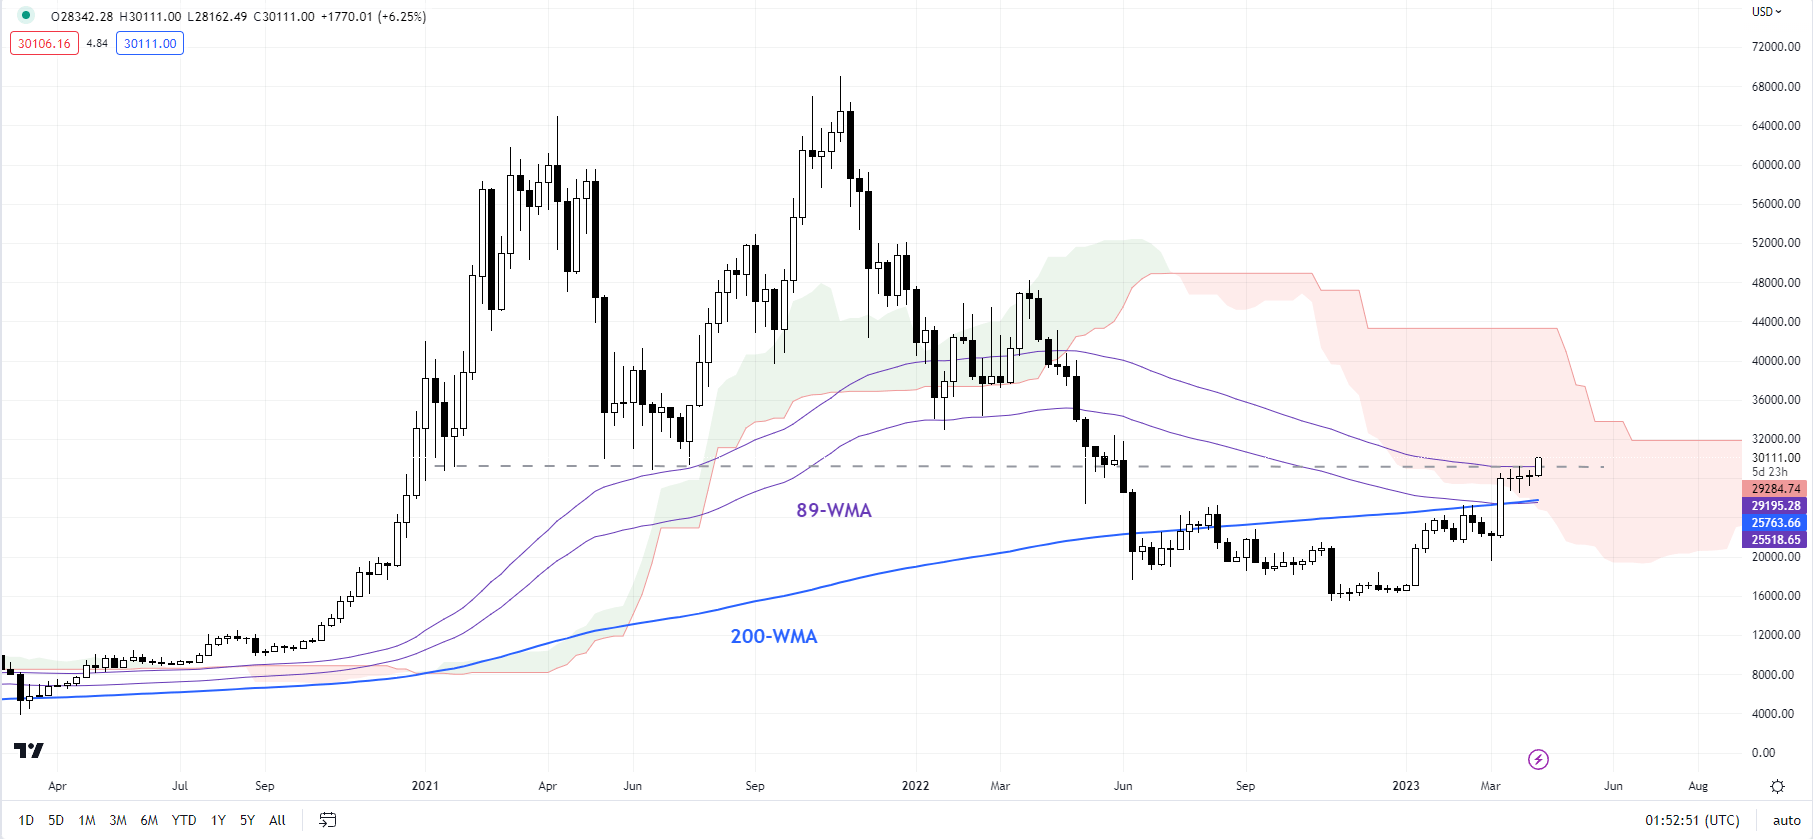
Chart Created by Manish Jaradi Using TradingView
BTC/USD rose in Q1-2023 above the 200-day moving average, the 89-day moving average, and the lower edge of the Ichimoku cloud on the daily charts. The downward correction in March truncated at the 200-day moving average, further reinforcing the nascent uptrend.
BTC/USD Daily Chart
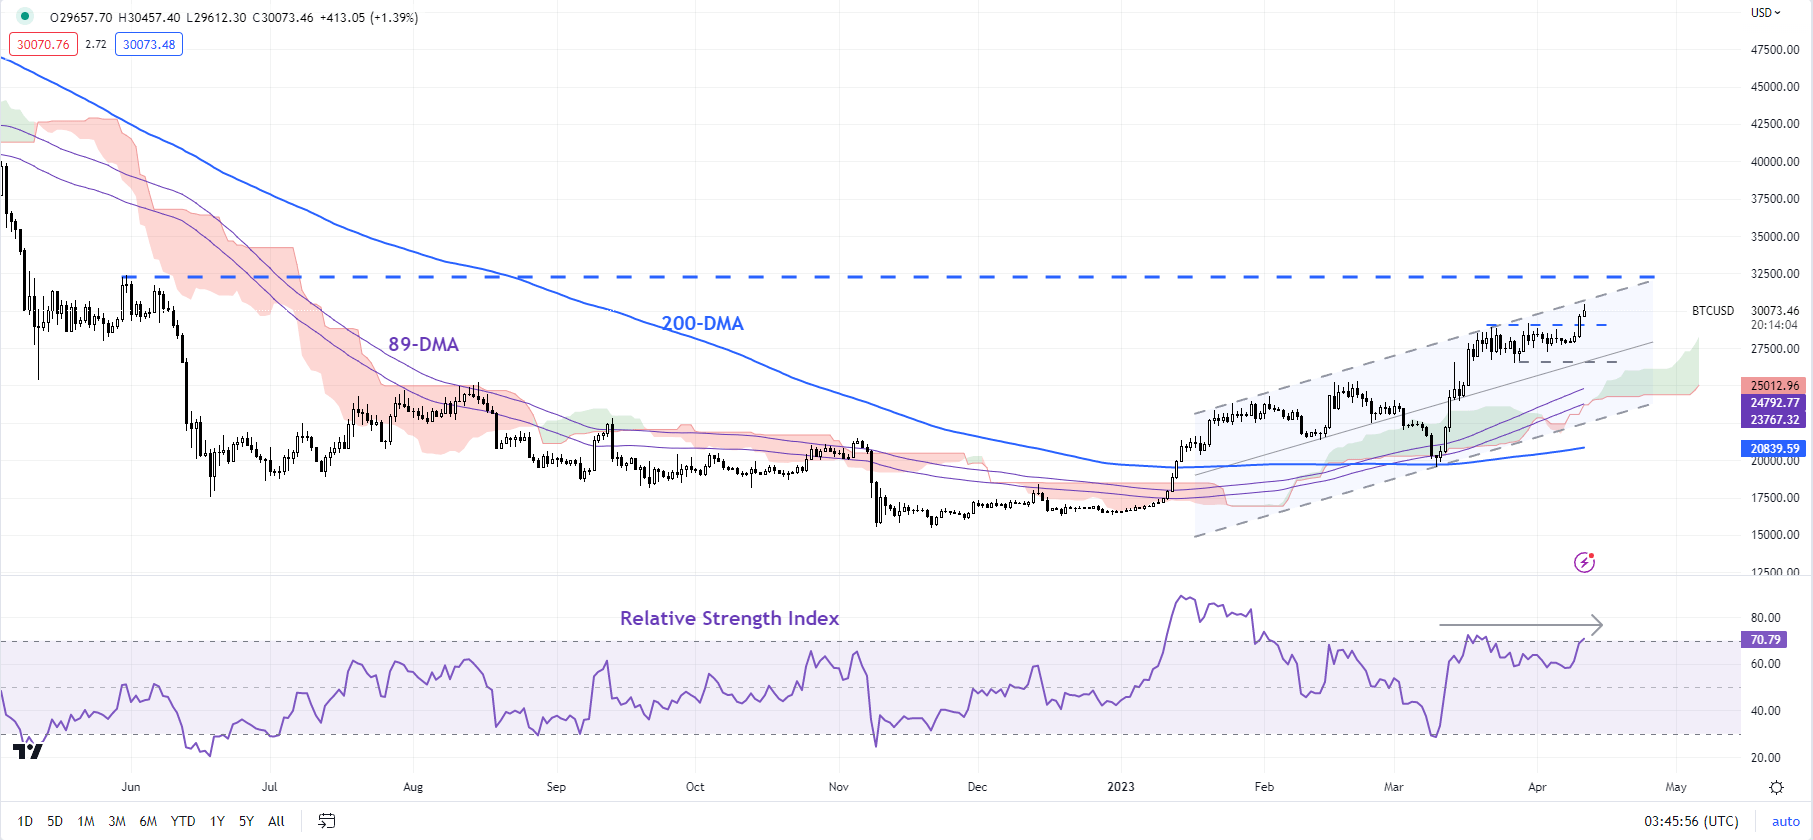
Chart Created by Manish Jaradi Using TradingView
In the very near term, this week’s surge has come about on lower momentum, raising the prospect of minor fatigue in the rally, especially given the pace and the extent of the recent gains. Still, there is immediate support at the end-March low of 26525. Only a break below the support would indicate that the upward pressure had eased somewhat in the short term.
Trade Smarter – Sign up for the DailyFX Newsletter
Receive timely and compelling market commentary from the DailyFX team
Subscribe to Newsletter
— Written by Manish Jaradi, Strategist for DailyFX.com
— Contact and follow Jaradi on Twitter: @JaradiManish
Comments are closed.