

- EUR/USD stays defensive after reversing from seven-week high, as well as snapping five-day uptrend.
- Break of weekly support line, downbeat oscillators favor sellers even if 61.8% Fibonacci retracement prods immediate declines.
- Recovery moves need validation from 1.0935 to aim for fresh 2023 high.
EUR/USD seesaws around 1.0830-20 as the key Fibonacci retracement level probes bears during early Friday, following the Euro pair’s U-turn from a seven-week high the previous day.
EUR/USD marked the first daily loss in six on Thursday as it failed to cross the two-month-old horizontal resistance area surrounding 1.0930-35. The following pullback also broke an upward-sloping support line from Monday and allowed intraday sellers to tighten the grip.
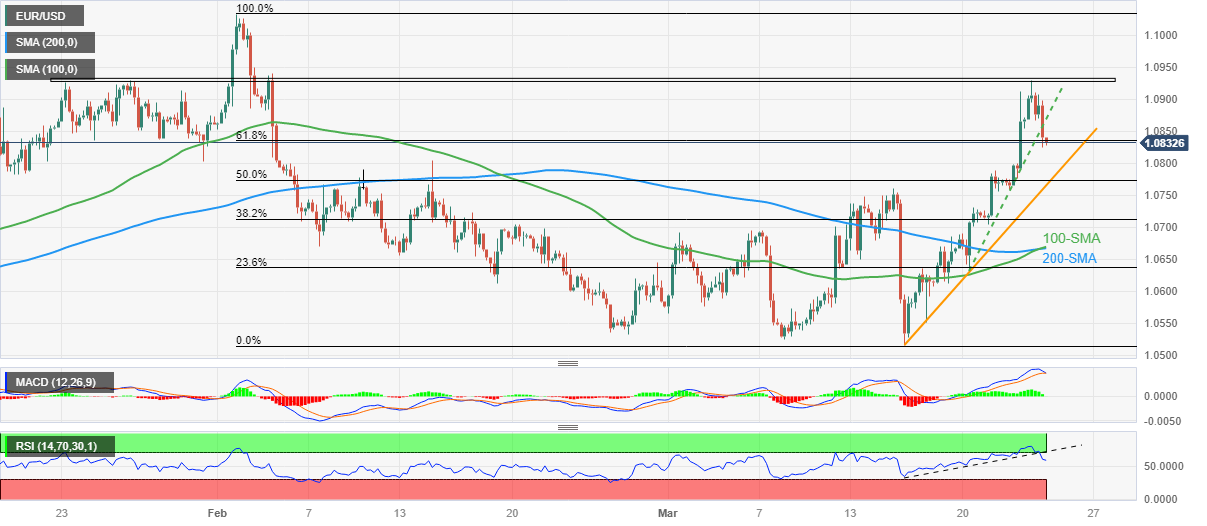
It should be noted that the RSI’s U-turn from the overbought territory breaks short-term support and the MACD also teases bears, which in turn suggests the EUR/USD pair’s further downside even if the 61.8% Fibonacci retracement of February-March fall prods sellers of late.
That said, an upward-sloping support line from March 15 joins the mid-month high to keep the EUR/USD bear’s focus on the 1.0765-60 support zone.
If the pair manages to break the same, it could quickly drop to a convergence of the 100-SMA and 200-SMA, around 1.0670-65.
Alternatively, the EUR/USD pair’s recovery moves may initially aim for the support-turned-resistance line stretched from Monday, near 1.0885 at the latest.
However, bulls should remain cautious unless witnessing a clear break of 1.0935. Following that, a run-up towards refreshing the yearly high, around 1.1035 at the latest, can’t be ruled out.
EUR/USD: Four-hour chart
Trend: Further downside expected
Comments are closed.