Bears eye a break of key support structures
- AUD/USD´s 0.6720s on the upside are key.
- A break of 0.6670s and then the 0.6650s opens risk to the 0.6620s as the last defense for a significant run lower.
The Australian Dollar was not far from four-month lows touched in March in mid-week trade while investors weigh the monetary policy outlook domestically and abroad and US-China tensions. However, AUD/USD is poised bearish on the chart as the following technical top-down analysis illustrates:
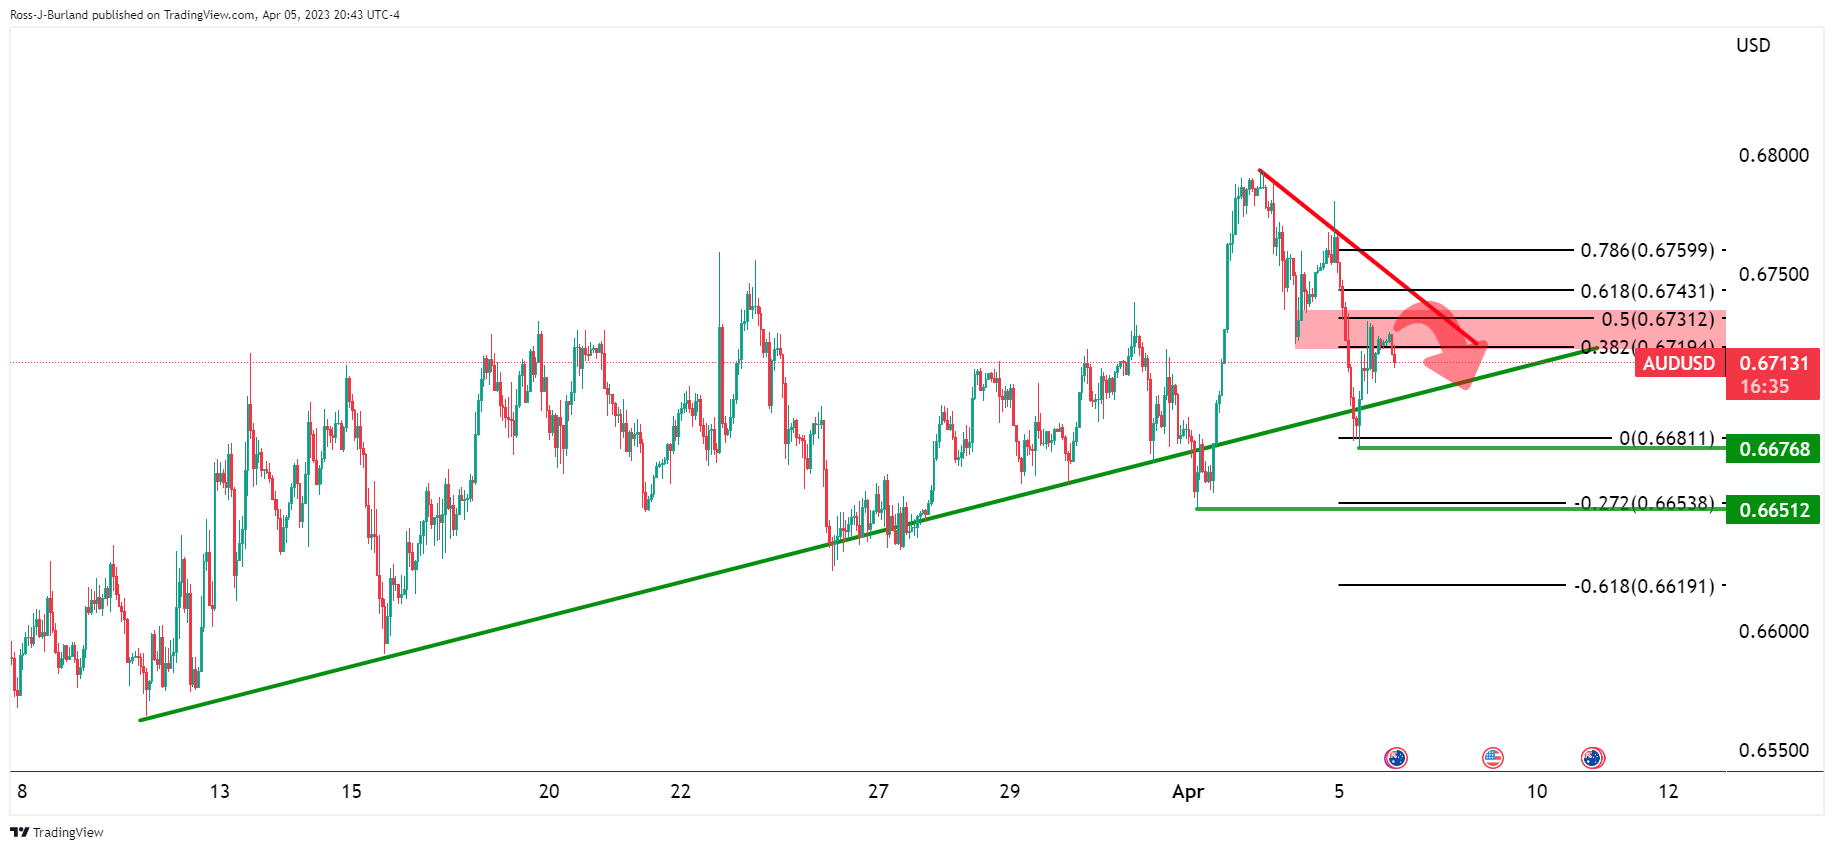
AUD/USD H1 chart prior analysis
It was stated in the prior analysis, that AUD/USD had pulled back into the neckline of the M-formation in a 50% mean reversion of the hourly impulse. This area was anticipated to act as resistance ´´and lead to an eventual break of the trendline support and then 0.6650.´´
AUD/USD updates
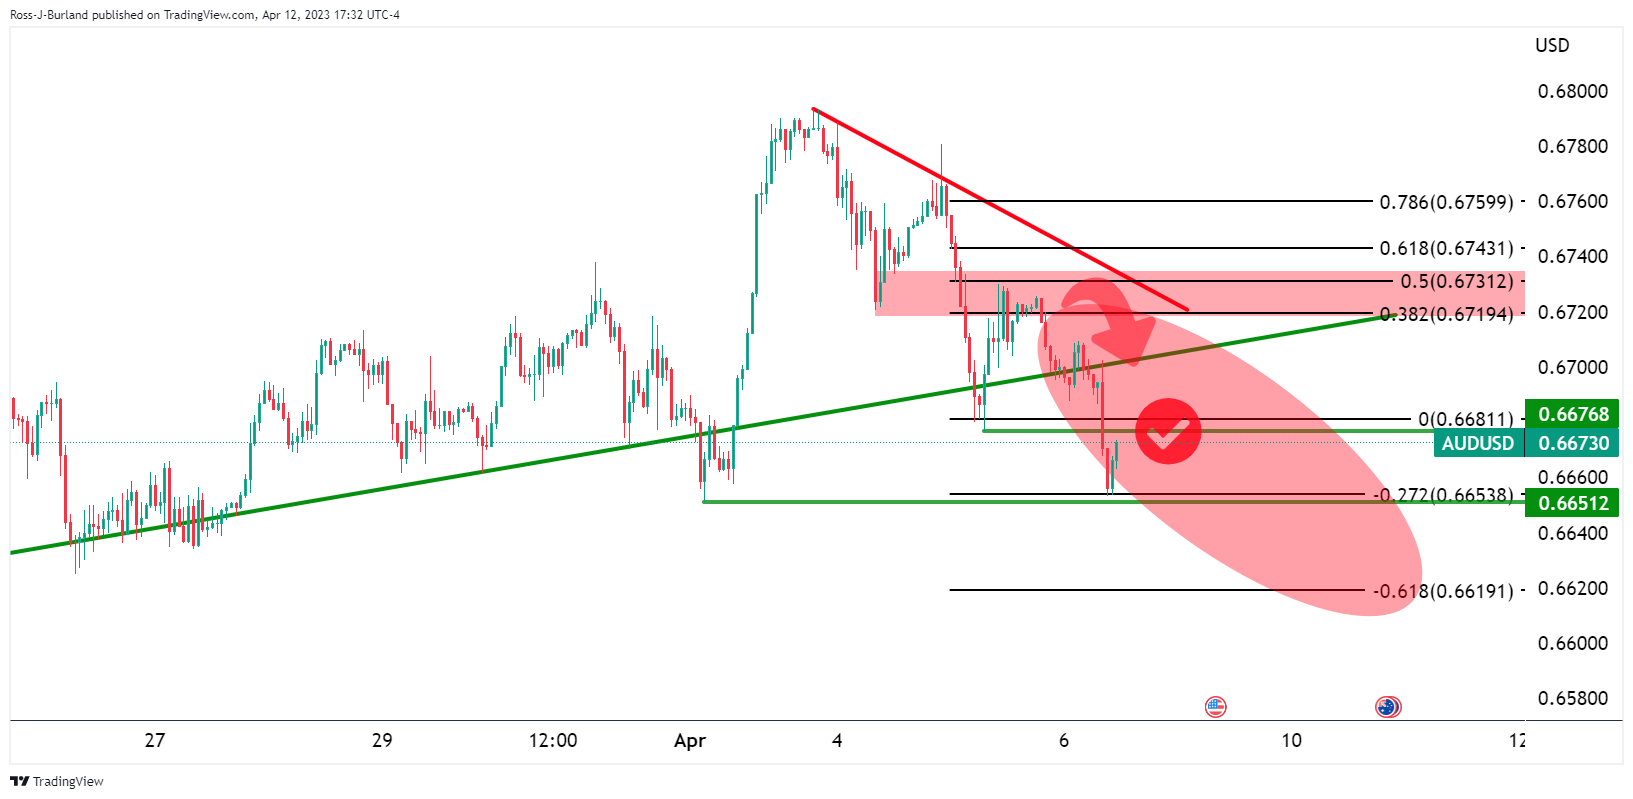
This particular analysis played out as illustrated above. Over the course of the days, the price continued lower:
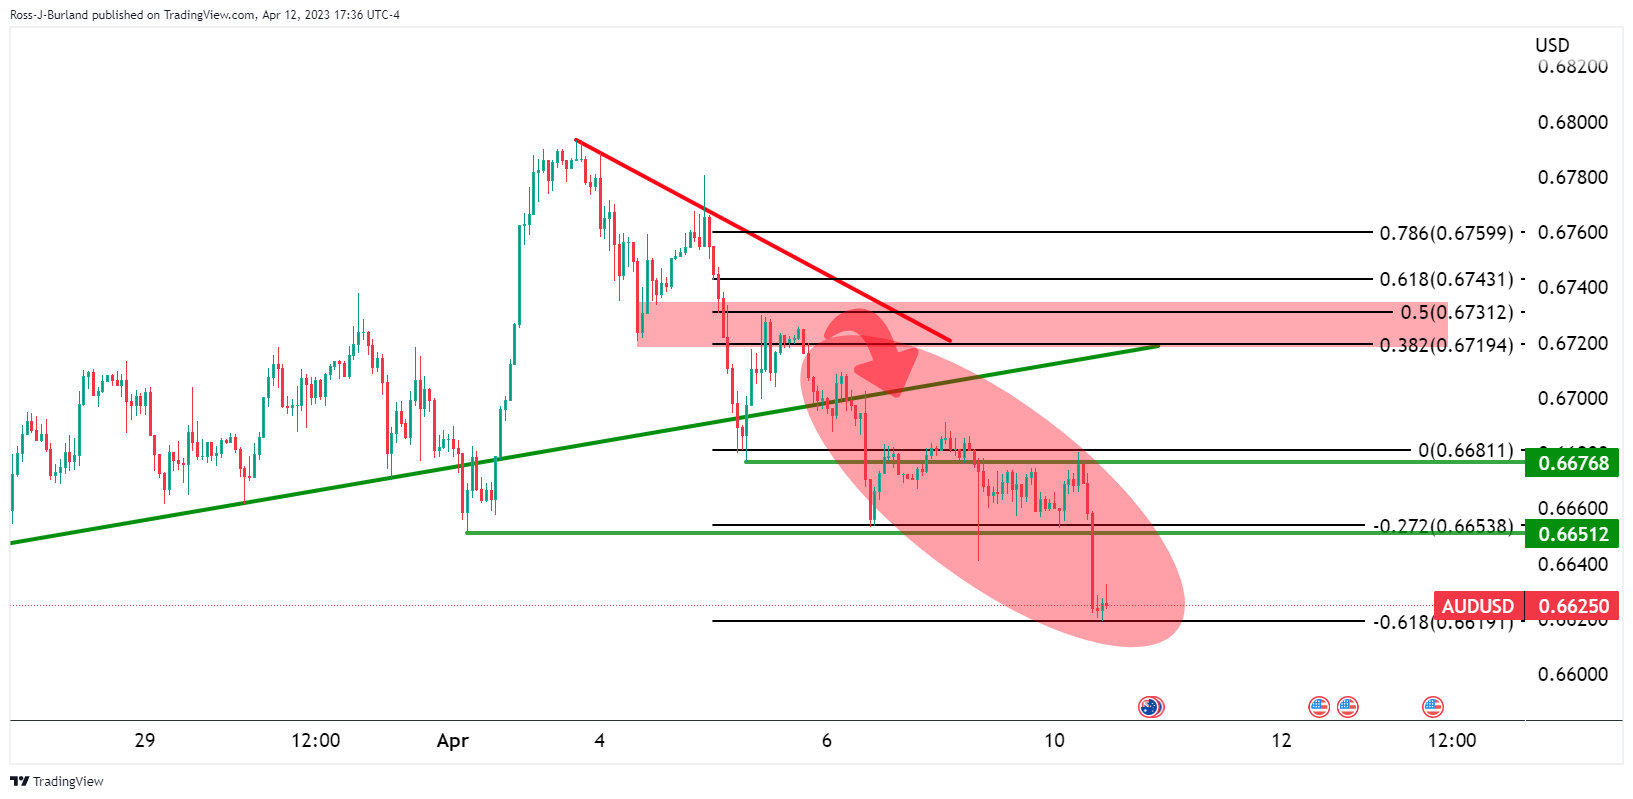
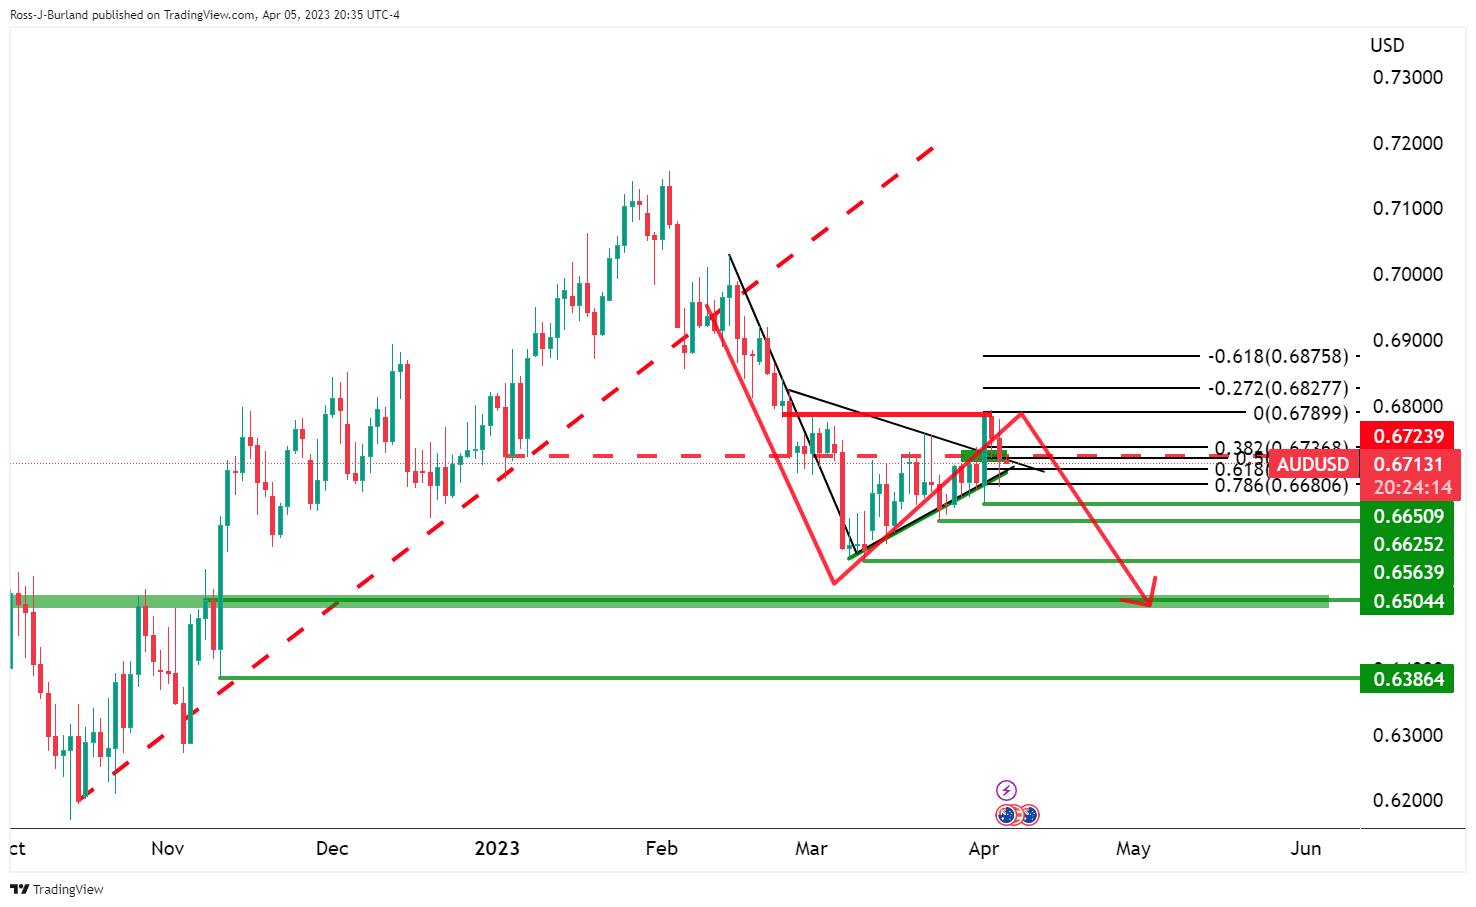
This is significant in relation to the overall bearish thesis as outlined in the prior analysis on the daily chart:
AUD/USD daily chart update
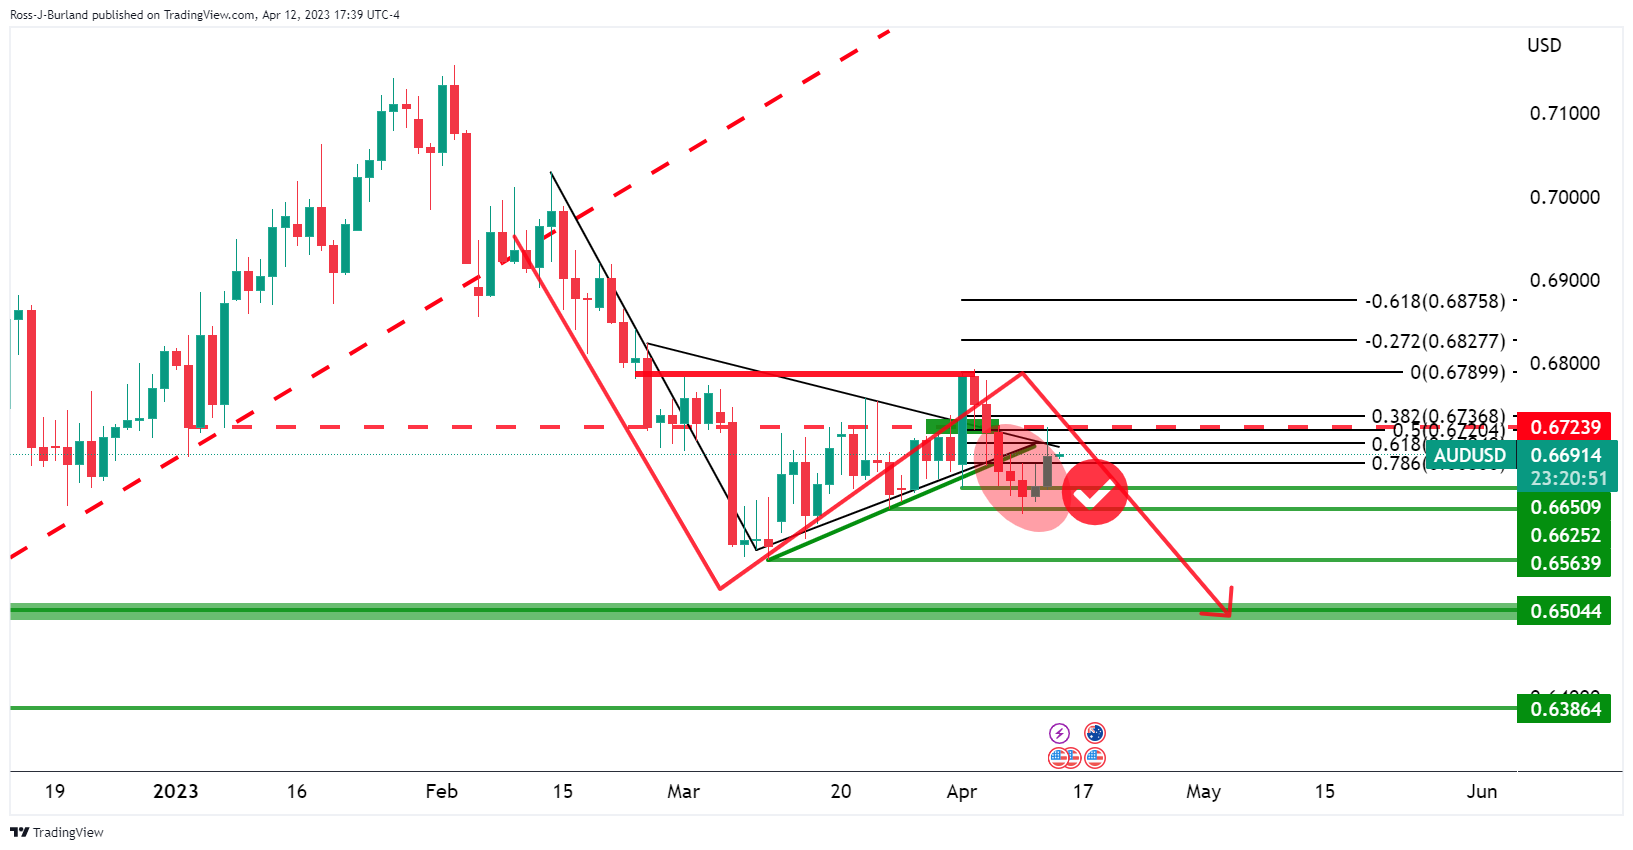
Cleaning up the chart a touch and zooming in, we can see when drawing the Fibonacci measurement tool on the correction´s length, the -272% ratio aligns with the targetted 0.6500s.
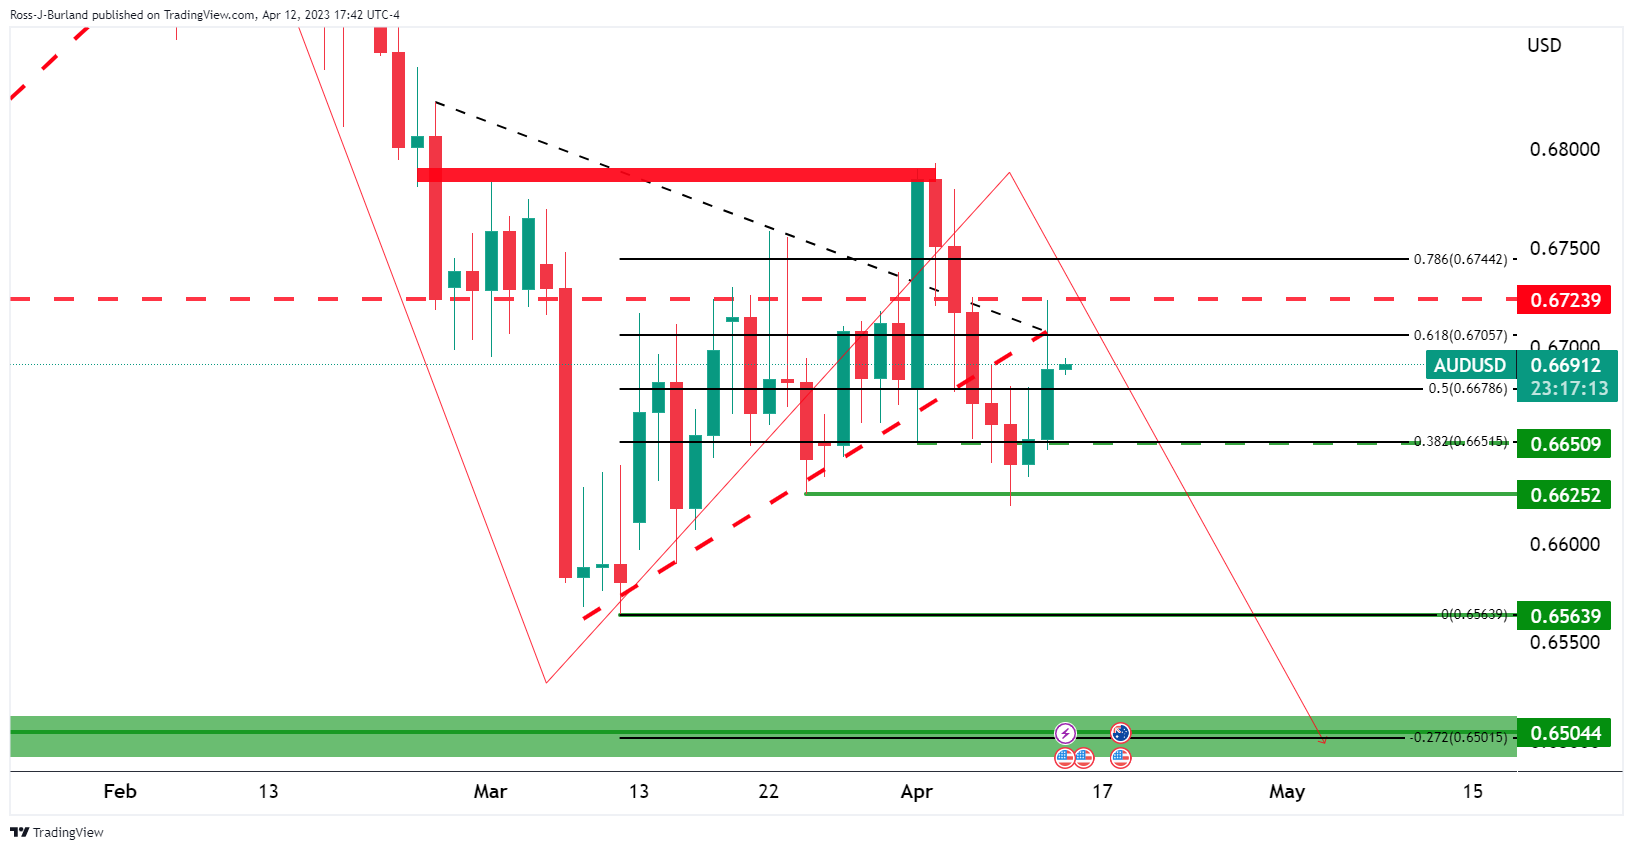
Cleaning up the chart even more so, we can see the break of the support structure, pull back into a 61.8% resistance area, and restest of the counter trendline. A premium has been given to the bears looking to get in on the break of structure who are targeting a significant downside breakout of the geometrical pattern towards 0.6500:
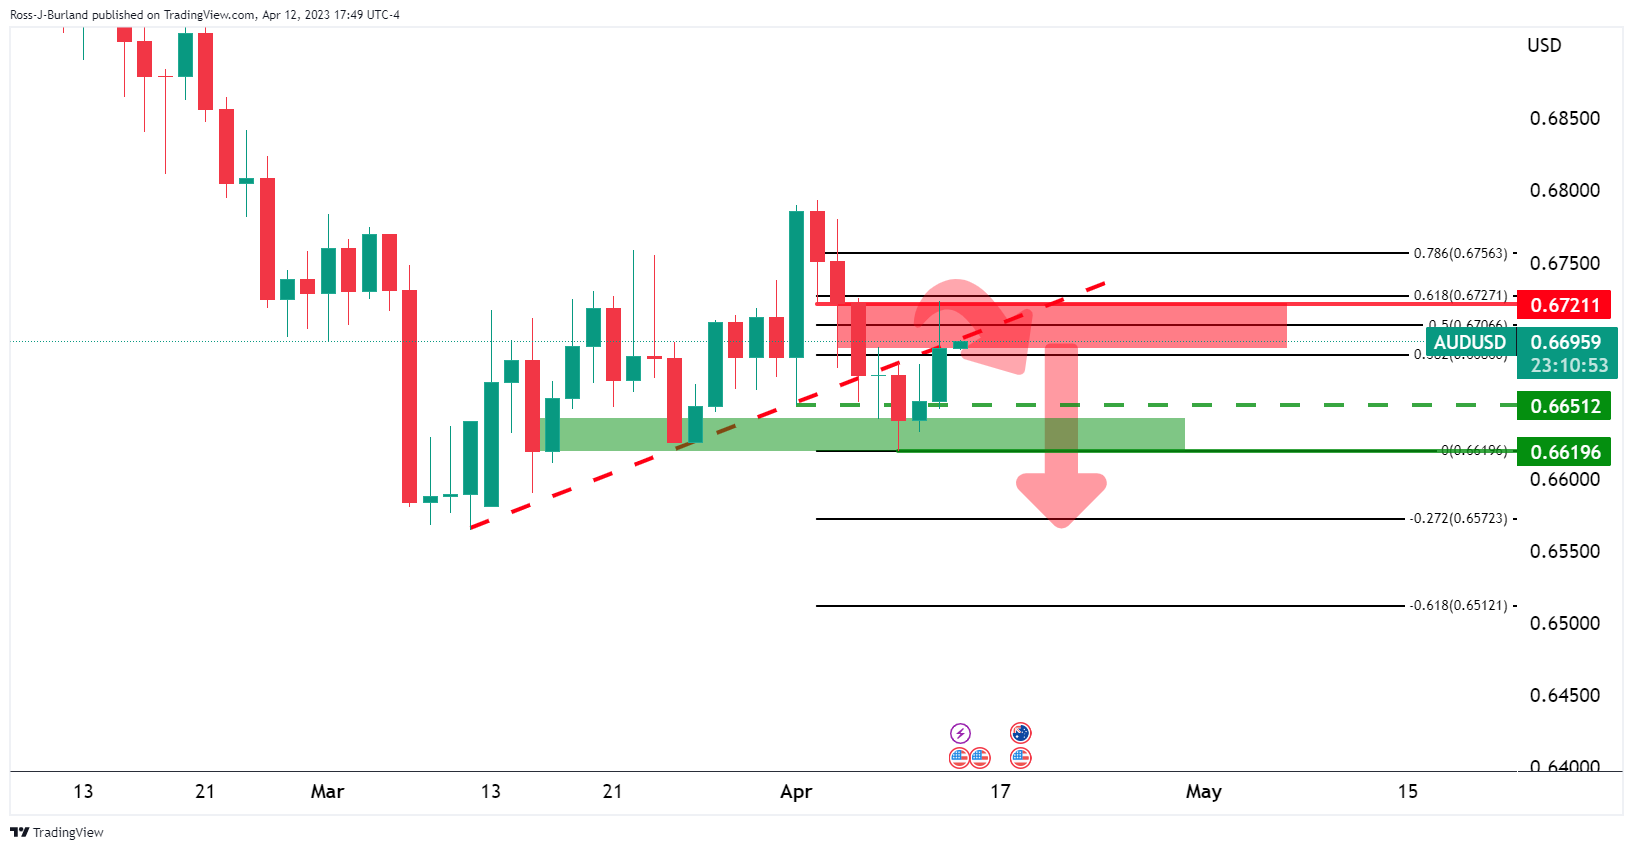
AUD/USD H4 chart
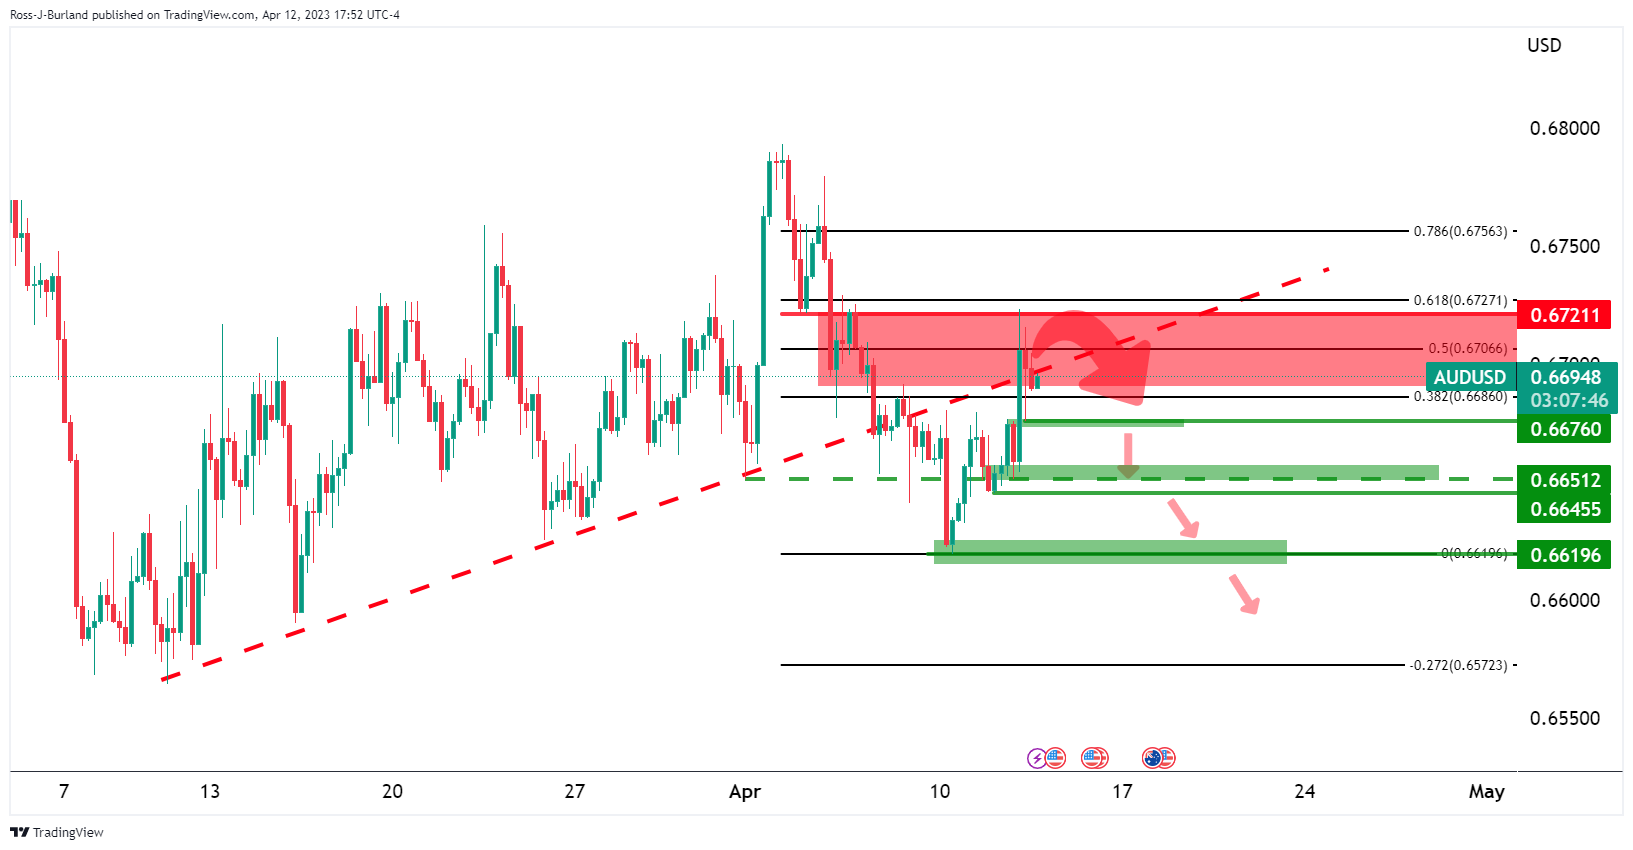
Meanwhile, there are a number of key levels and market structures as illustrated on the 4-hour chart. 0.6720 on the upside is key and should this fend off the bulls, then a break of the 0.6670s and then the 0.6650s opens risk to the 0.6620s as the last defense for a significant run lower towards 0.6550 and 0.6500 thereafter.


Comments are closed.