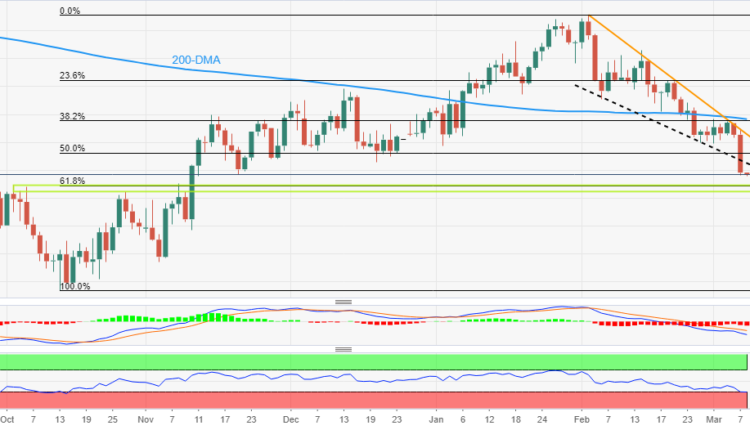
Bears appear well-set to approach 0.6540 support
- AUD/USD remains depressed at the lowest levels in four months.
- Clear downside break of previous support line from February, bearish MACD signals favor Aussie pair sellers.
- 61.8% Fibonacci retracement level, five-month-old horizontal support zone join oversold RSI (14) to challenge bears.
- AUD/USD recovery remains elusive below 0.6780-85 resistance confluence.
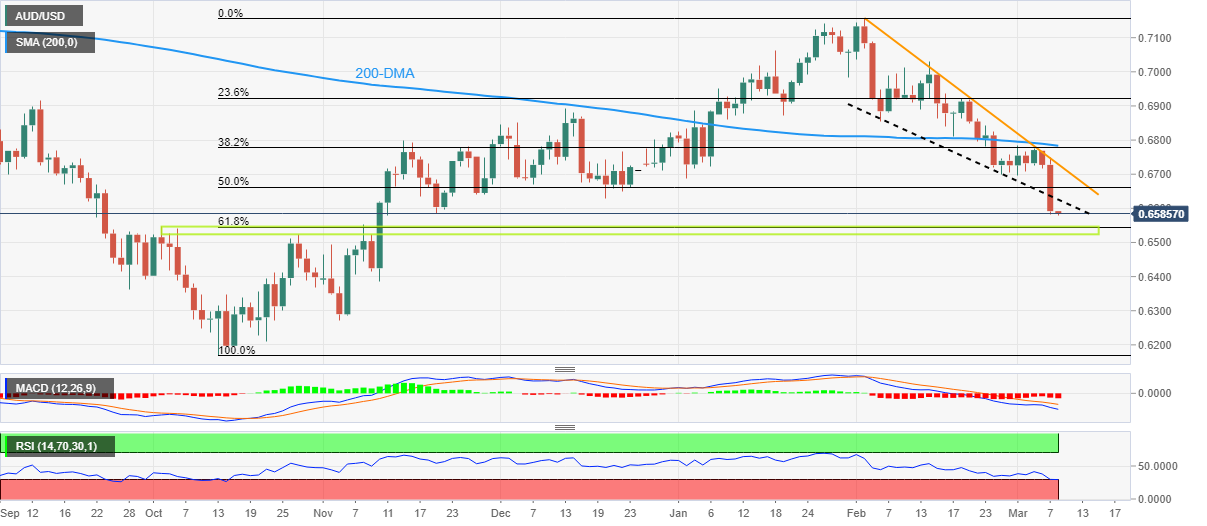
AUD/USD bears keep the reins at a four-month low, making rounds to 0.6580-90 during early Wednesday, following the biggest daily slump in a month.
That said, a clear downside break of a one-month-old descending trend line joins the bearish MACD signals to keep the Aussie sellers in the driver’s seat even if the latest inaction probes the downside momentum. On the same line could be the oversold conditions of the RSI (14) line.
Even so, the AUD/USD prices remain on their way to hitting the next key support area, namely the 0.6540-20 region comprising the 61.8% Fibonacci retracement level of October 2022 to February 2023 upside and multiple levels marked in the last five months.
It’s worth noting that the Aussie pair’s weakness past 0.6520 could aim for the last September’s low surrounding 0.6360 and may witness multiple supports near 0.6350-40 before highlighting the late 2022 bottom of around 0.6170.
Alternatively, the support-turned-resistance line from early February, close to 0.6630 by the press time, precedes the 50% Fibonacci retracement level of 0.6665 to cap the short-term upside of the AUD/USD pair.
Following that, a one-month-old descending resistance line near 0.6720 could lure the pair buyers.
However, a convergence of the 200-DMA and 38.2% Fibonacci retracement, near 0.6780-85, appears a tough nut to crack for the AUD/USD bulls.
AUD/USD: Daily chart
Trend: Limited downside expected


Comments are closed.