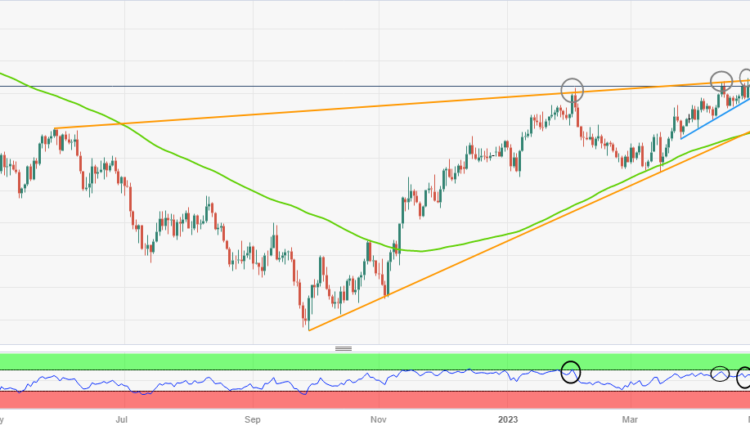
Bearish RSI divergence prods Euro bulls, US GDP, 1.1090 eyed
- EUR/USD struggles around 13-month high amid bearish RSI divergence on daily chart.
- Higher high on Euro prices fail to gain support from RSI (14), suggesting a pullback in EUR/USD.
- Failure to cross 11-month-old ascending resistance line adds strength to the bearish bias.
- One-month-old ascending trend line restricts immediate downside, 1.0765-55 appears a tough nut to crack for Euro bears.
EUR/USD stays defensive at the highest levels since March 2022, marked the previous day, as bulls run out of steam ahead of the key US first quarter (Q1) Gross Domestic Product (GDP) during early Thursday. That said, the Euro pair picks up bids to pare the late Wednesday’s retreat from the multi-day high to around 1.1045 by the press time.
The Euro pair refreshed a 13-month high but failed to provide a daily closing beyond an upward-sloping resistance line from May 2022, around 1.1090 by the press time.
Apart from the failure to cross the crucial resistance line, the bearish RSI divergence with the latest run-up in the EUR/USD price also teases the Euro pair sellers on an important data release day.
The EUR/USD pair’s tops marked since early February fail to gain support from the RSI (14) line as the higher high in prices commensurate the lower low of the oscillator, which in turn suggests a pullback in the quote before the next leg of the uptrend.
However, a one-month-old ascending support line, close to 1.0970 by the press time, could challenge the intraday sellers of the pair.
Following that, a convergence of the 100-DMA and an upward-sloping trend line from September 2022, close to 1.0765-55, will be in the spotlight as a break of which could reverse the pair’s upward trajectory from late 2022.
Alternatively, a daily closing beyond the 1.1090 resistance line won’t hesitate to challenge the March 2022 high of around 1.1185.
EUR/USD: Daily chart
Trend: Pullback expected


-27042023-638181507863161258.png)
Comments are closed.