
Natural Gas, Momentum Keeps Fading, Bearish Rectangle – Technical Update:
- Natural gas prices continue stabilizing around the February low
- A Bearish Rectangle chart pattern is brewing on the 4-hour chart
- Keep a close eye for a potential breakout and key levels to watch
Trade Smarter – Sign up for the DailyFX Newsletter
Receive timely and compelling market commentary from the DailyFX team
Subscribe to Newsletter
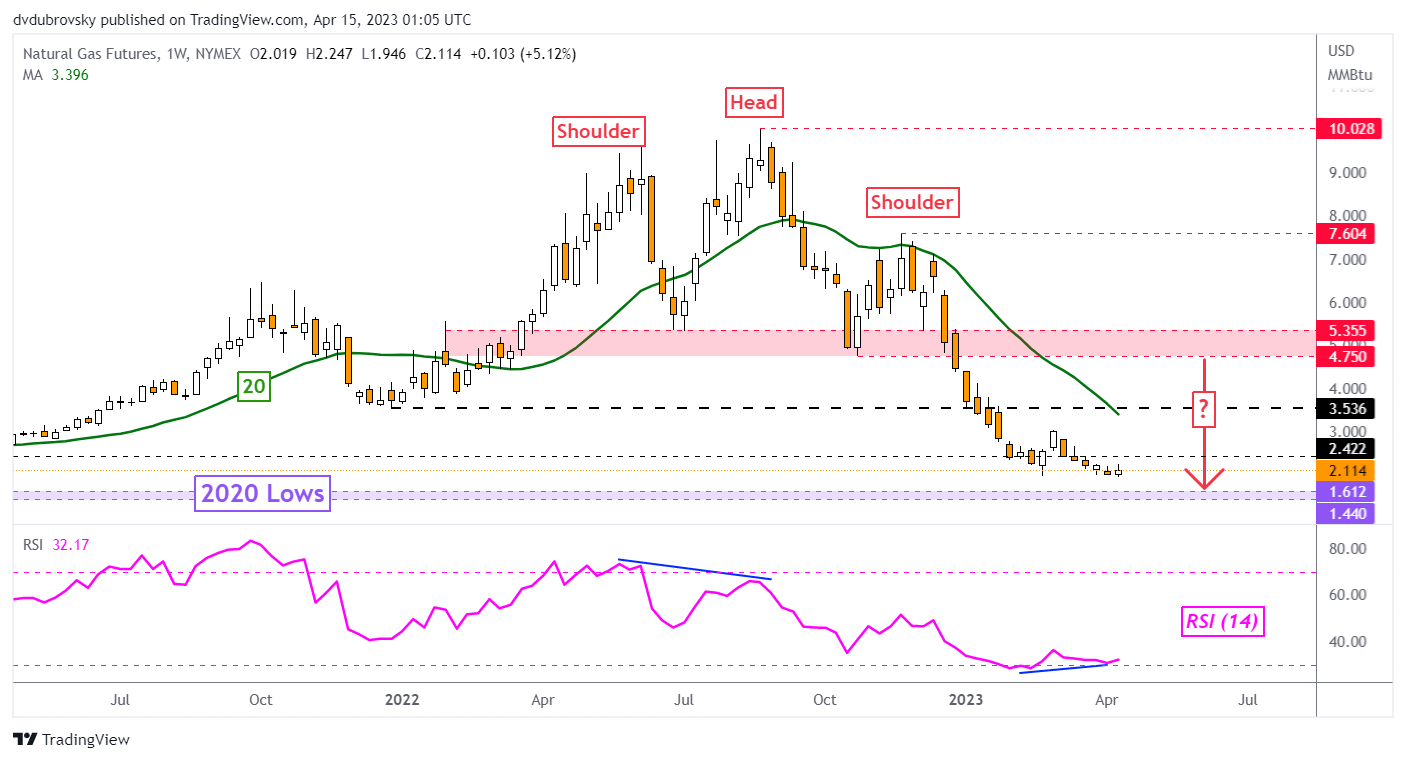
Weekly Chart – Momentum Fading
Natural gas prices were once again left little changed this past week as the heating commodity struggled to find any momentum to either clear through critical support or push past resistance. Looking at the Average True Range (ATR), the past 14-day period has been some of the quietest since August 2021. Overall, prices are struggling to find follow-through in the context of what has been a bearish play of a Head & Shoulders breakout since the end of last year. Positive RSI divergence continues growing, indicating a rising risk of a reversal.

Chart Created Using TradingView
Daily Chart – Support Reinforced
On the daily chart, we can get a better idea of how prices are stabilizing around support. The latter is the February low at 1.967, which was first retested in late March. Since then, prices have been unable to break lower. Moreover, positive RSI divergence is also growing on the daily chart.
The 50-day Simple Moving Average (SMA) is holding as key resistance, maintaining the broader downside bias. It is closing in as well. As such, it will be important to watch this line in the event of a turn higher in the week ahead. Such an outcome exposes the March high at 3.027.
On the other hand, breaking lower exposes the 23.6% Fibonacci retracement level at 1.696 towards the 2020 bottom at 1.44.
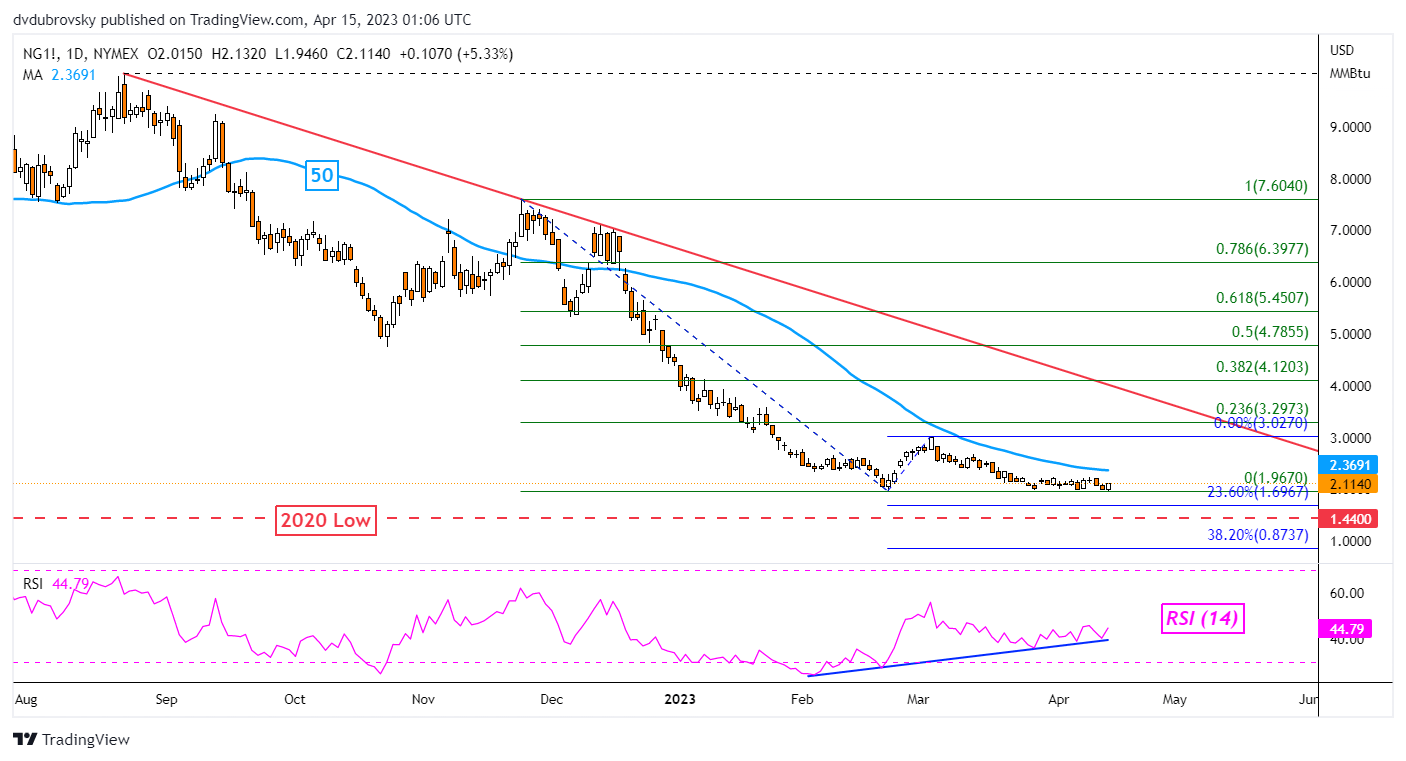
Chart Created Using TradingView
4-Hour Chart – Bearish Rectangle Brewing?
Zooming in even closer on the 4-hour timeframe for a near-term outlook this week, it seems that a Bearish Rectangle chart formation is brewing. The floor seems to be established around 1.998 with the ceiling around 2.238. A breakout lower could open the door to extending the downtrend that occurred during most of March.
Until a breakout in either direction occurs, the current technical bias seems neutral. Of note, the 100-period SMA has held as key resistance this past week, maintaining the downside bias. Pushing above this line could open the door to revisiting the ceiling of the rectangle.
Recommended by Daniel Dubrovsky
The Fundamentals of Breakout Trading
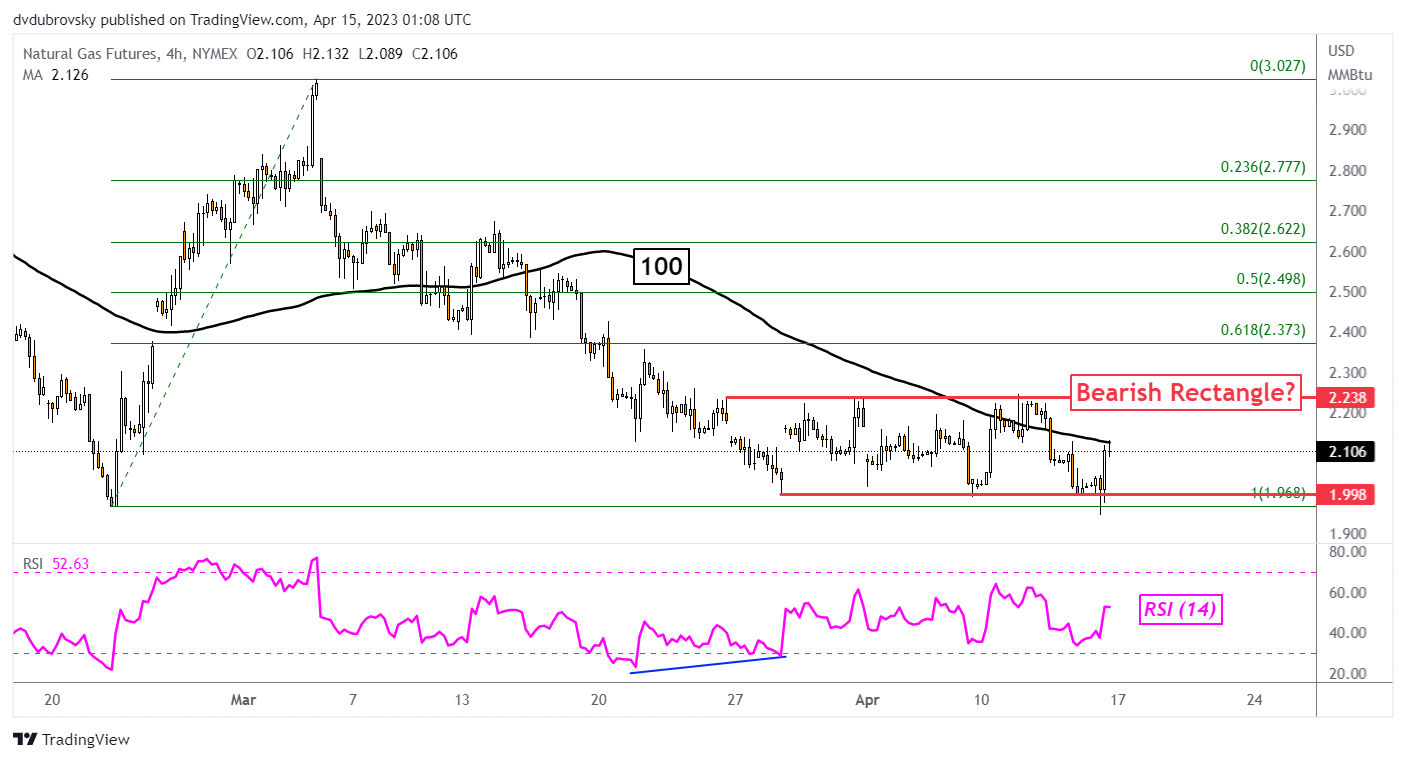
Chart Created Using TradingView
— Written by Daniel Dubrovsky, Senior Strategist for DailyFX.com
To contact Daniel, follow him on Twitter:@ddubrovskyFX
Comments are closed.