
Natural Gas, RSI, Bearish Rectangle Breakout – Technical Update:
- Natural gas prices resumed broader losing streak last week
- Trajectory continues to be in line with a Head & Shoulders
- Near-term Bearish Rectangle breakout more to worry about?
Trade Smarter – Sign up for the DailyFX Newsletter
Receive timely and compelling market commentary from the DailyFX team
Subscribe to Newsletter
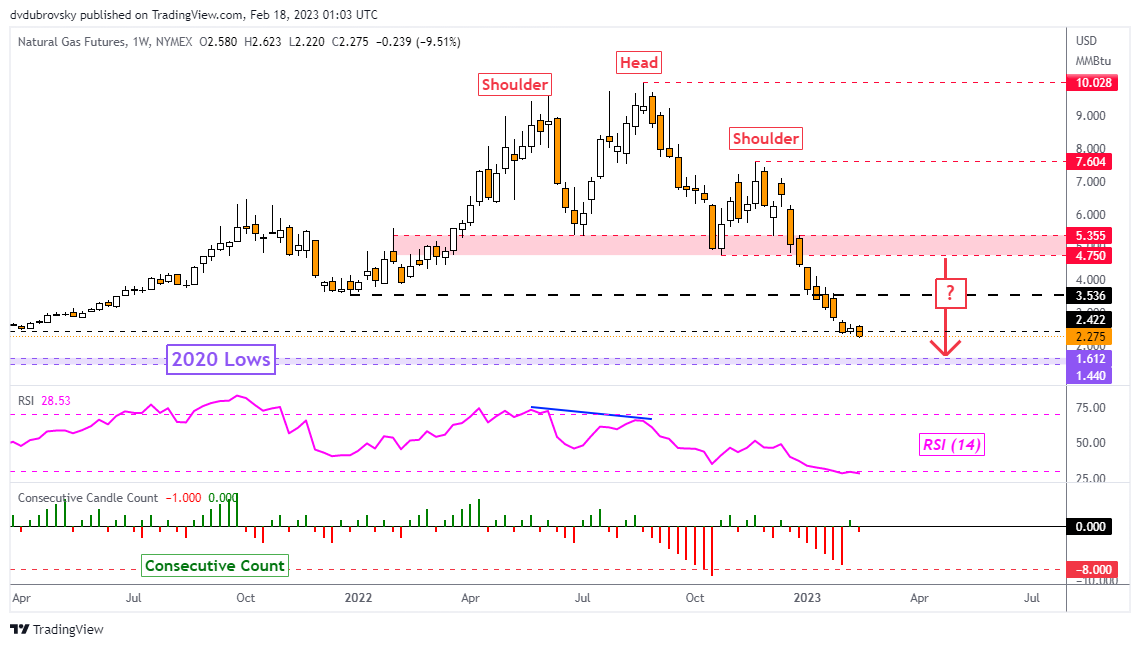
Weekly Chart – Bearish Head & Shoulders Target Closing In
Natural gas prices continued a broader losing streak since the summer of 2022 last week. Following a brief pause on the week of February 6th, the commodity fell 9.5% over the past 5 trading sessions. Prices also confirmed a breakout under the March 2021 low. This meant the lowest close since September 2020. Moreover, it seems prices are continuing to follow the bearish trajectory of a Head & Shoulders chart formation. Is more pain ahead?

Chart Created Using TradingView
Daily Chart – Downside Momentum Fading
On the daily chart, prices have finally closed under a series of lows established since the end of January. With it, natural gas also took out the 100% Fibonacci extension level at 2.326. That has exposed the 114.6% level at 1.555. But, positive RSI divergence is present. While it does not guarantee that a reversal is at hand, it does show that downside momentum is fading. That can at times precede a turn lower. Still, in the event of a bounce, the 20-day Simple Moving Average (SMA) could hold as resistance, maintaining the downside focus.
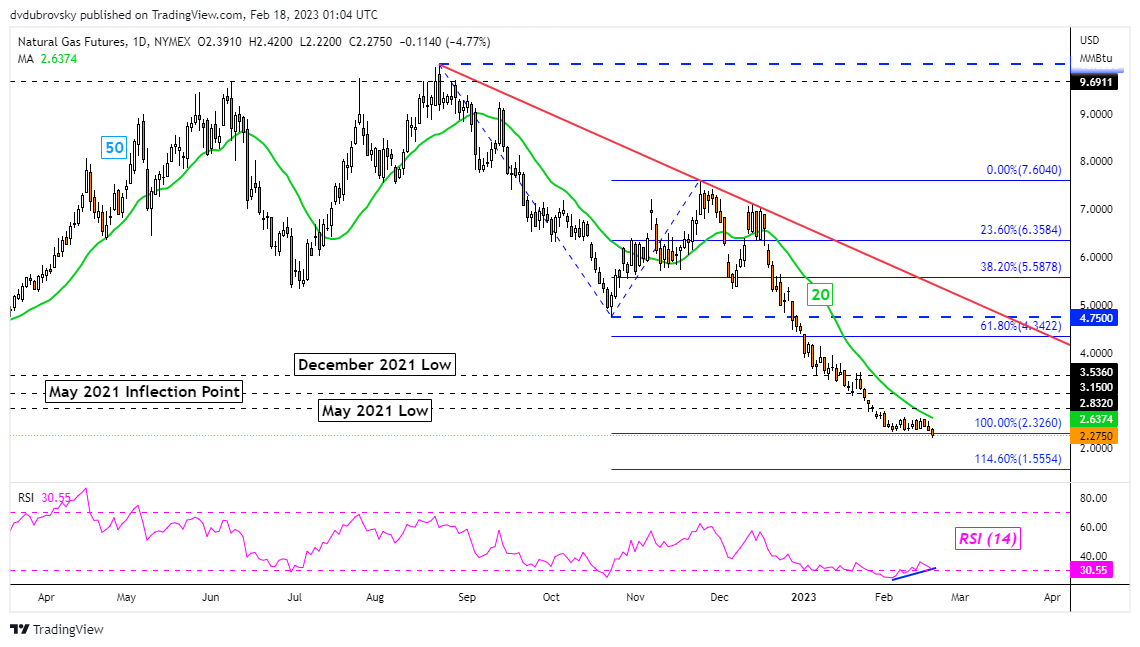
Chart Created Using TradingView
4-Hour Chart – Bearish Rectangle Breakout Eyed
Zooming in further on the 4-hour setting reveals that prices confirmed a breakout under a Bearish Rectangle chart pattern – as expected. That has opened the door to extending losses toward the 138.2% and 150% Fibonacci extension levels at 2.162 and 2.04, respectively. Meanwhile, the 100-period SMA remains tilted lower and may hold as key resistance in the event of a turn higher. A push back into the rectangle may offer an increasingly neutral outlook.
Recommended by Daniel Dubrovsky
The Fundamentals of Breakout Trading
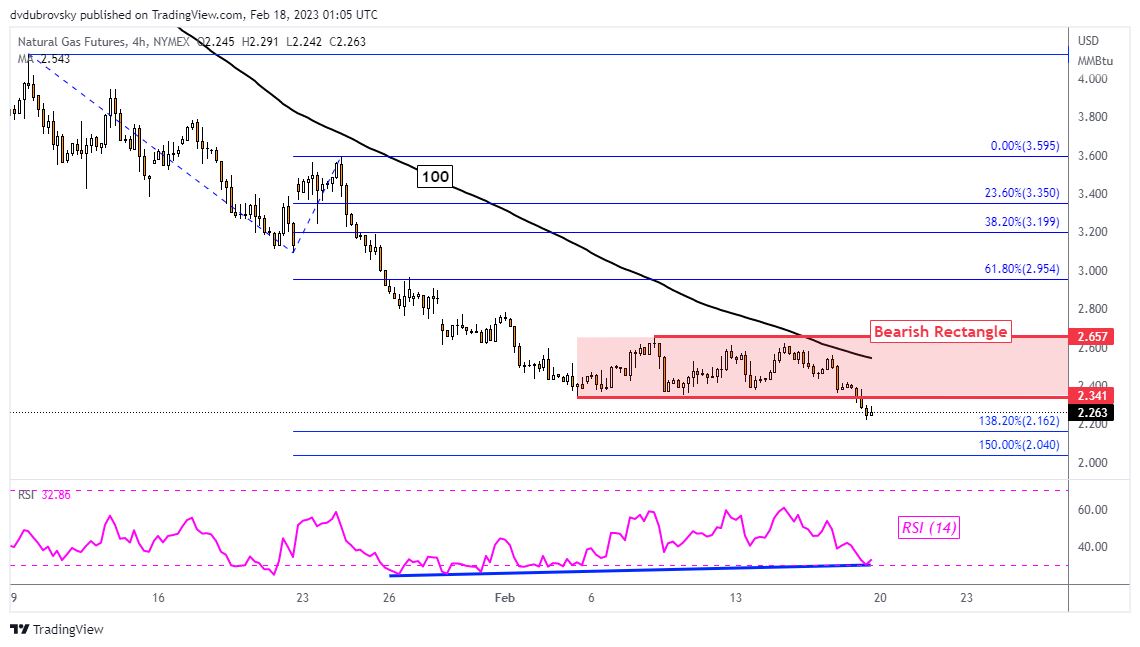
Chart Created Using TradingView
— Written by Daniel Dubrovsky, Senior Strategist for DailyFX.com
To contact Daniel, follow him on Twitter:@ddubrovskyFX
Comments are closed.