

US Dollar, DXY Index – Outlook:
- The Fed kept interest rates on hold but projected two additional rate hikes in 2023 and not rate cuts until 2025.
- However, the market is pricing in one more rate hike this year and rate cuts as soon as next year.
- What does this mean for the US dollar?
Recommended by Manish Jaradi
Traits of Successful Traders
The US dollar index’s (DXY index) fall below key support suggests the market seems to be at odds with the US Federal Reserve’s hawkish hold.
The Fed kept interest rates steady at its meeting in the past week but unexpectedly delivered a hawkish surprise by projecting two additional rate hikes in 2023 given the disappointingly slow decline in inflation. The resilience of the economy to the tightened financial conditions, the raising of the US debt ceiling, and reduced risks from banking sector stress may have also contributed to the hawkish guidance.
While the Fed’s dot plot points to two more rate hikes until the end of the year, the market is pricing in a less than 100% chance of one rate hike this year, with rate cuts starting as soon as next year. In contrast, Fed Chair Powell said he doesn’t see a rate cut until inflation comes down meaningfully and significantly, and that can take a couple of years.
US Dollar Index (DXY) Daily Chart
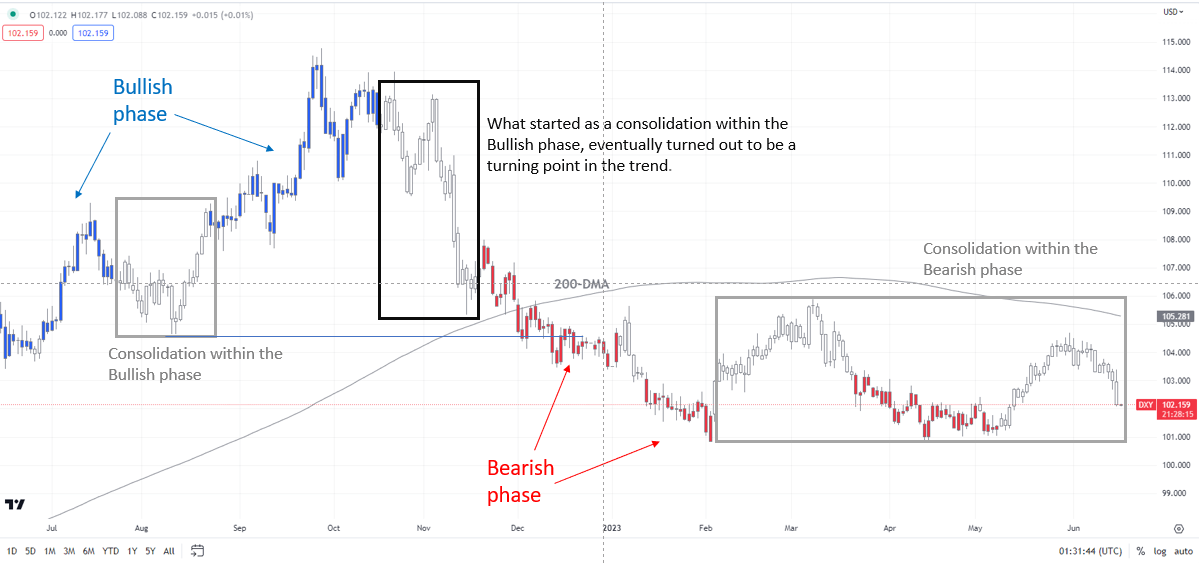
Chart Created by Manish Jaradi Using TradingView; Notes at the bottom of the page
The market’s dovish pricing seems to be based on the perception that Fed’s inflation forecasts have lagged realized inflation, and producer price inflation and import prices are already pointing to softness in activity. Fed officials upgraded their economic growth outlook for 2023 and see a slower drop in inflation. The core PCE price index is seen easing from the current 4.7% to 3.9% by the end of 2023, compared with the 3.6% on-year seen in March.
DXY Index Weekly Chart
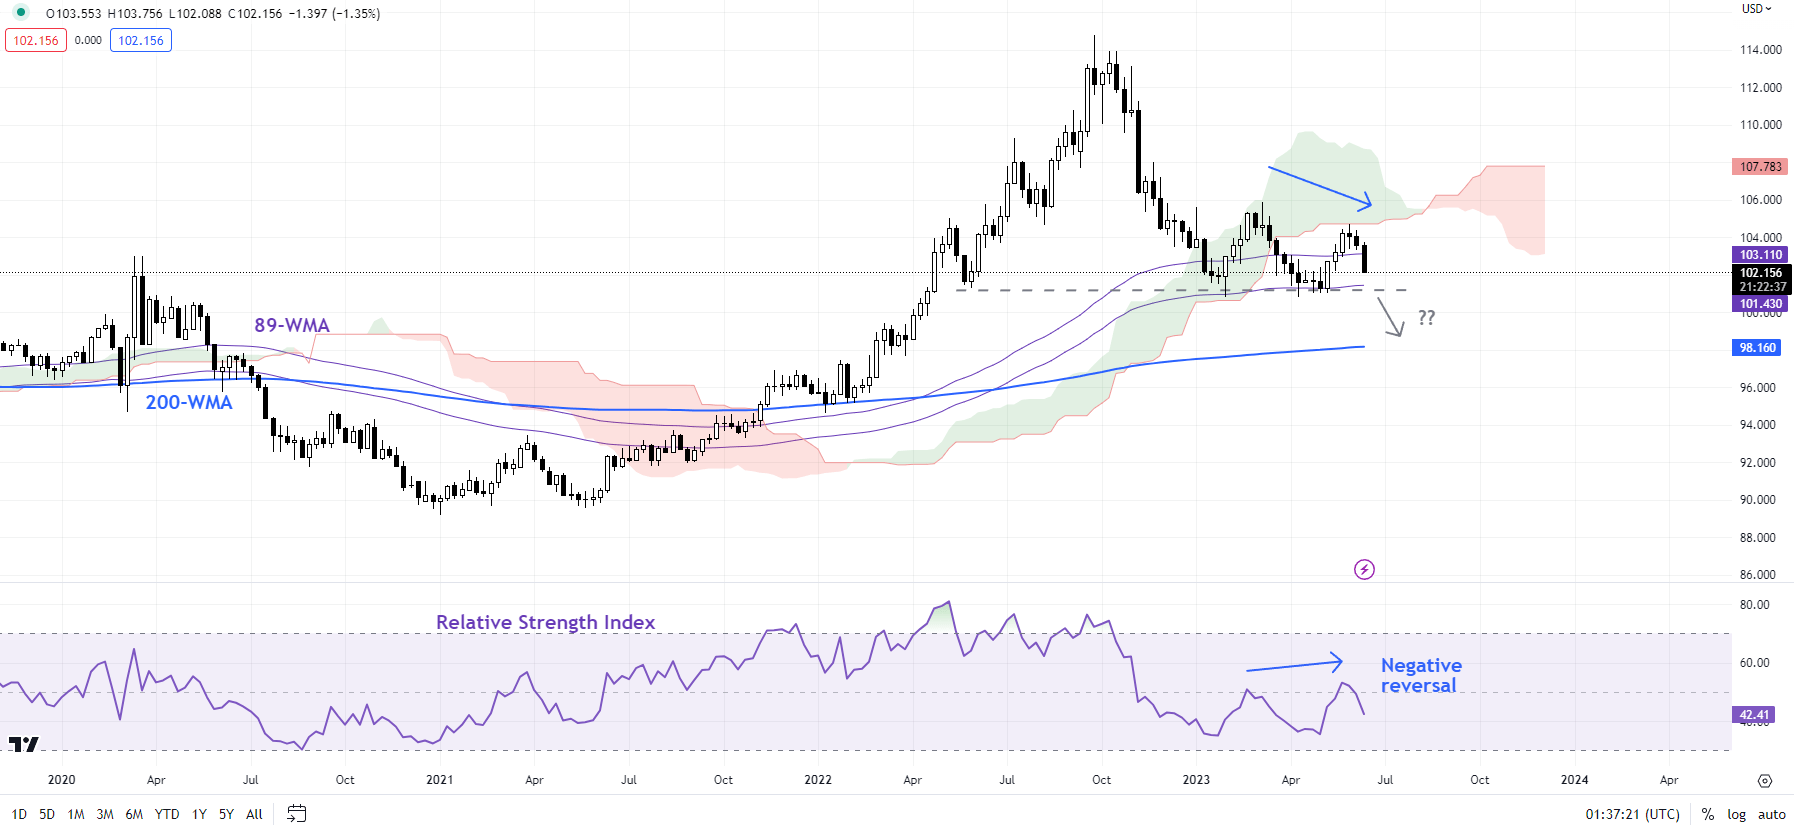
Chart Created by Manish Jaradi Using TradingView
On technical charts, the DXY index’s fall below vital support at the early-June low of 103.40 has confirmed that the month-long upward pressure has faded. The index looks set to be headed toward the April low of 100.80.
From a trend perspective, the US dollar has been in a downtrend since the start of 2023, as the colour-coded daily charts based on trending/momentum indicators show. This is further reinforced by the lower-highs-lower-lows sequence from late 2022. Below 100.80, the next support is seen on the 200-week moving average (now at about 98.20). Unless the index is able to rise above a stiff hurdle at the March high of 105.90, the path of least resistance remains sideways to down for the greenback.
Note: The above colour-coded chart(s) is(are) based on trending/momentum indicators to minimize subjective biases in trend identification. It is an attempt to segregate bullish Vs bearish phases, and consolidation within a trend Vs reversal of a trend. Blue candles represent a Bullish phase. Red candles represent a Bearish phase. Grey candles serve as Consolidation phases (within a Bullish or a Bearish phase), but sometimes they tend to form at the end of a trend. Candle colors are not predictive – they merely state what the current trend is. Indeed, the candle color can change in the next bar. False patterns can occur around the 200-period moving average, or around a support/resistance and/or in sideways/choppy market. The author does not guarantee the accuracy of the information. Past performance is not indicative of future performance. Users of the information do so at their own risk.
Trade Smarter – Sign up for the DailyFX Newsletter
Receive timely and compelling market commentary from the DailyFX team
Subscribe to Newsletter
— Written by Manish Jaradi, Strategist for DailyFX.com
— Contact and follow Jaradi on Twitter: @JaradiManish
Comments are closed.