

Australian Dollar, AUD/USD, US Dollar, AUD/JPY, Japanese Yen – Talking Points
- The Australian Dollar has found some strength overnight
- AUD/USD is in a range while AUD/JPY has popped higher
- If the trends continue, will momentum push AUD/USD higher still?
Recommended by Daniel McCarthy
How to Trade AUD/USD
AUD/USD TECHNICAL ANALYSIS
The Australian Dollar has steadied this week and it remains within an ascending trend channel.
AUD/USD had a look lower last week as it briefly dipped below 2 previous lows, but it was unable to sustain the bearish tilt.
That move also went below the long-term 260-day simple moving average (SMA). The inability to follow through could suggest that the dip has been rejected for now.
This has set up a potential support zone in the 0.6855 – 0.6870 area which currently coincides with a short-term ascending trend line and the 55-day SMA.
Further down, support might be at the 200-day SMA which is currently near the psychological level of 0.6800.
Below there is a longer-term ascending trend line at 0.6750 ahead of the previous lows of 0.6722 and 0.6688. The 100-day SMA lies between those price points and may lend support.
On the topside, resistance could be offered at the breakpoints and prior peaks of 0.6984, 0.7011, 0.7137 and 0.7158. The latter is the 12-month high that failed to break the topside of the ascending trend channel. That line might continue to provide resistance, currently dissecting at 0.7240.
Looking at momentum, the SMAs could indicate some sideways price action with a possible slight bullish bias. While the price is above the medium and long-term 55-, 100-, 200- and 260-day SMAs, it is below the short-term 10- and 21-day SMAs.
AUD/USD DAILY CHART
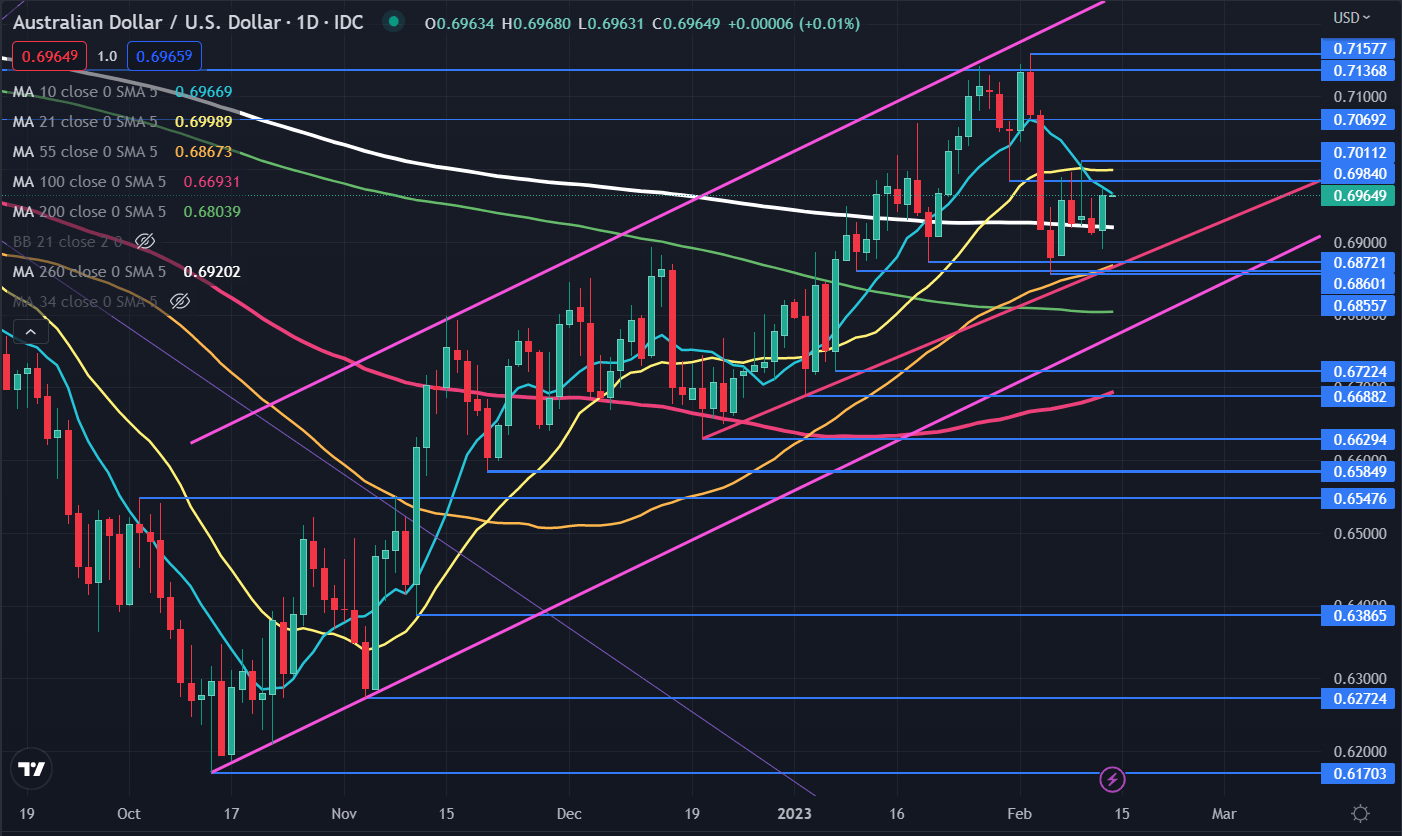
Chart created in TradingView
Trade Smarter – Sign up for the DailyFX Newsletter
Receive timely and compelling market commentary from the DailyFX team
Subscribe to Newsletter
AUD/USD TECHNICAL ANALYSIS
AUD/JPY has broken above a descending trend line and made a 2-week high overnight.
If it remains above the trend line, it may indicate that bearish momentum is fading, and a possible reversal could unfold.
The price once again moved above the Ichimoku Kinko Hyo, which is often referred to as the Ichimoku Cloud, which might suggest that bullishness may evolve.
A move back below the Senkou Span A (Leading Span A) could question the bullish slant.
Resistance might be at the previous peaks of 92.82, 93.36, 94.13 and 94.65.
On the downside, support may lie at the prior lows of 90.23, 88.12, 87.41, 87.30 and 87.03. An ascending trend line could provide support, currently at 88.60.
AUD/JPY DAILY CHART
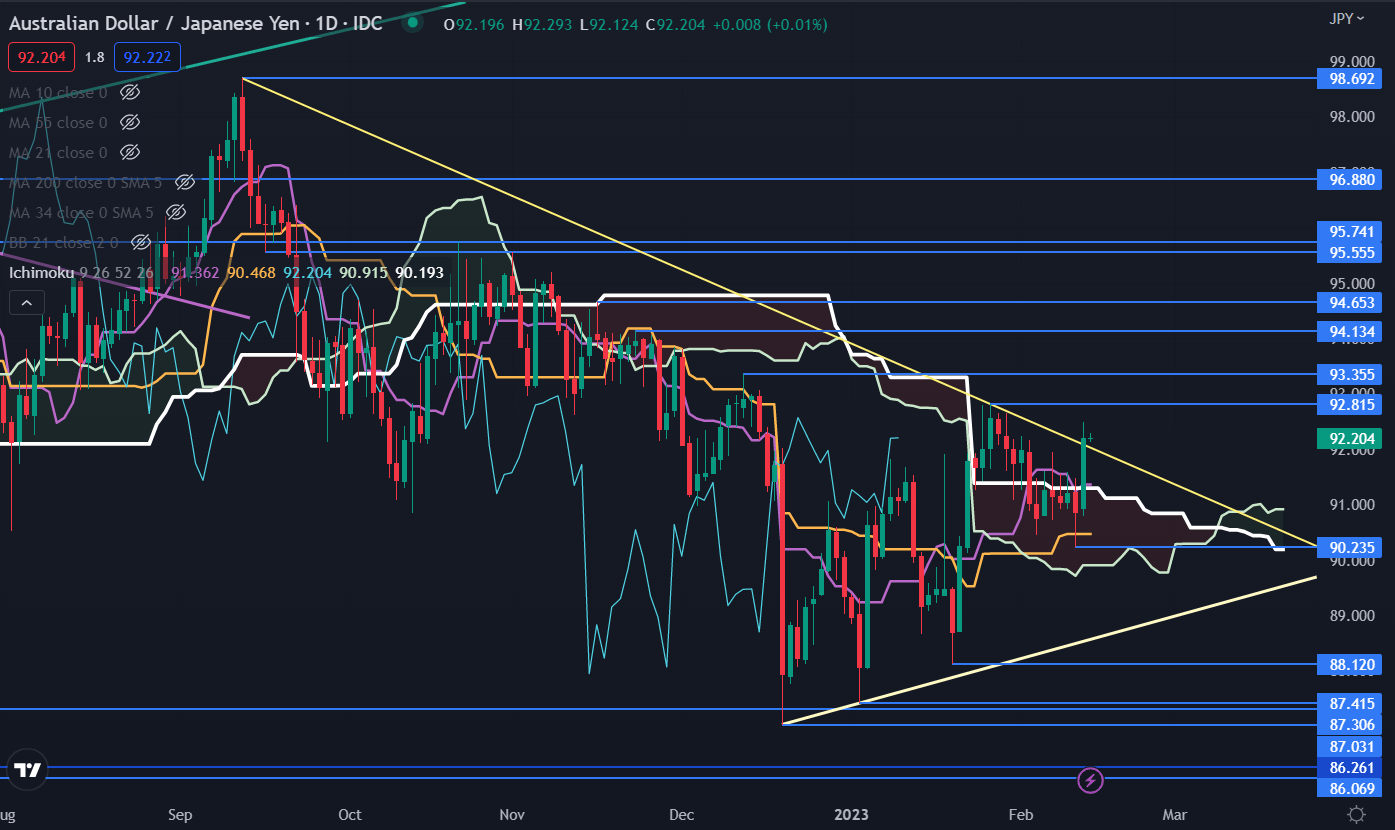
Chart created in TradingView
— Written by Daniel McCarthy, Strategist for DailyFX.com
To contact Daniel, use the comments section below or @DanMcCathyFX on Twitter
Comments are closed.