

- The AUD/NZD pair is struggling to develop momentum as the Antipodeans both sink.
- New Zealand economic data is 0-for-2 in the back half of the trading week as NZ PMI declines.
- Early Friday sees RBA Monetary Policy Statement release, set to confirm dovish stance.
The AUD/NZD has fallen back into the 1.080 region as the Aussie (AUD) wins the slow race between itself and the Kiwi (NZD) for weakest links in Thursday trading, with both currencies either declining or seeing all gains erased on the day.
The Aussie slid into a three-week low against the Kiwi heading into the Friday trading session, and the AUD has closed in the red for five of the last six consecutive trading days.
Australia: RBA is seen keeping rates unchanged in December – UOB
After the Reserve Bank of Australia (RBA) struck a dovish tone at their last meeting despite delivering a 25 basis point rate hike, Aussie traders are racing each other to the exist as the Australian central bank looks set to grapple with a weak economic outlook for the immediate future. The RBA stood pat on interest rates for the previous four consecutive meetings, and concerns are rising that even with the weak economic outlook, the RBA isn't doing enough to effectively combat inflation that keeps proving stickier than the central bank is willing to accept.
On the Kiwi side, NZ Purchasing Managers' Index figures for October continued to decline, printing at 42.5 compared to September's showing of 45.3 as operators expect worsening economic conditions moving forward.
New Zealand Business PMI eases to 42.5 in October vs. 45.3 prior
The RBA is set to release their latest Monetary Policy Statement, which will do little for AUD investors but highlight the Australian central bank's dovish stance.
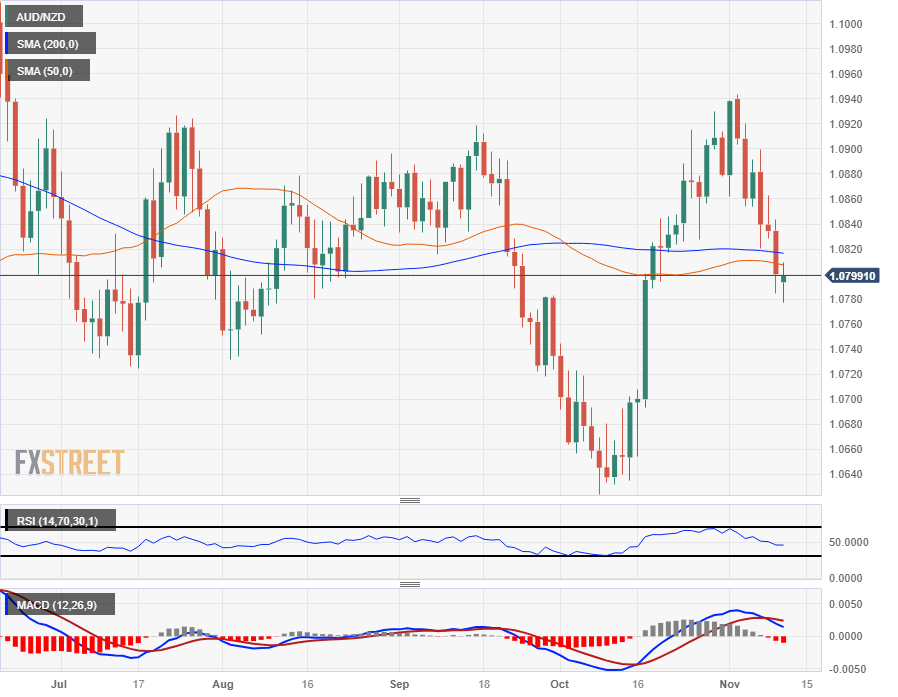
AUD/NZD Technical Outlook
The Aussie-Kiwi pairing has tumbled back into the bearish side of the 200-day Simple Moving Average (SMA) and the 50-day SMA is cycling close by, adding technical resistance from Thursday's peak bids near 1.0810.
Further downside will see the pair set for an extension into October's low bids near 1.0640, and there's little technical support to provide the AUD need lift in the chart paper if bears continue to apply pressure.
Australian Dollar price this week
The table below shows the percentage change of Australian Dollar (AUD) against listed major currencies this week. Australian Dollar was the weakest against the US Dollar.
| USD | EUR | GBP | CAD | AUD | JPY | NZD | CHF | |
| USD | 0.59% | 1.23% | 1.07% | 2.34% | 1.22% | 1.74% | 0.43% | |
| EUR | -0.59% | 0.65% | 0.48% | 1.74% | 0.63% | 1.13% | -0.16% | |
| GBP | -1.25% | -0.67% | -0.17% | 1.11% | -0.02% | 0.49% | -0.82% | |
| CAD | -1.08% | -0.49% | 0.17% | 1.26% | 0.14% | 0.65% | -0.66% | |
| AUD | -2.39% | -1.78% | -1.14% | -1.28% | -1.15% | -0.61% | -1.95% | |
| JPY | -1.24% | -0.64% | -0.20% | -0.14% | 1.11% | 0.47% | -0.78% | |
| NZD | -1.76% | -1.15% | -0.49% | -0.66% | 0.61% | -0.52% | -1.32% | |
| CHF | -0.44% | 0.16% | 0.81% | 0.64% | 1.90% | 0.78% | 1.30% |
The heat map shows percentage changes of major currencies against each other. The base currency is picked from the left column, while the quote currency is picked from the top row. For example, if you pick the Euro from the left column and move along the horizontal line to the Japanese Yen, the percentage change displayed in the box will represent EUR (base)/JPY (quote).
AUD/NZD Daily Chart
AUD/NZD Technical Levels
Comments are closed.