Chart Art: Trend and Range Plays for the U.S. Dollar Index (DXY) and Cardano (ADA/USD)
Welcome to the last trading day of the month!
Whether you’re into fiat currencies or you prefer trading cryptos today, I got your back with a trend play on DXY and a range opportunity on ADA/USD.
See if you can end the month on a strong note with these setups!
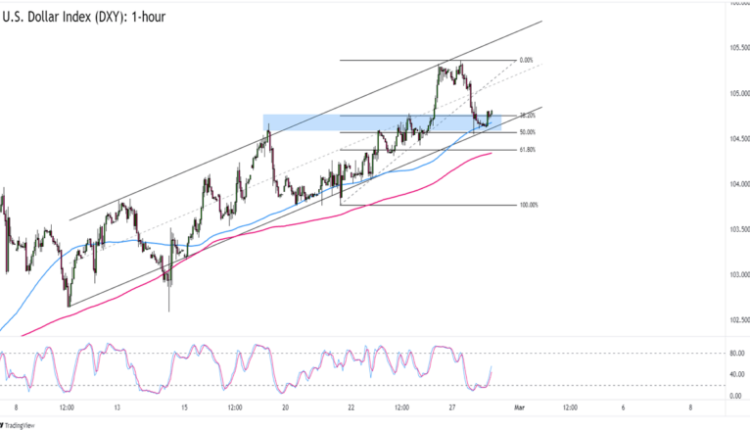
U.S. Dollar Index (DXY): 1-hour

U.S. Dollar Index (DXY) 1-Hour Forex Chart by TradingView
First up is a textbook trend trade for the U.S. dollar. As you can see, the dollar index (DXY) looks ready to bounce from the 1-hour chart’s 100 SMA.
The moving average is a good enough excuse to buy USD but this time the latest downswing ended near an ascending channel support AND the 50% Fibonacci pullback of last week’s upswing.
Look out for momentum above today’s consolidation as it can push DXY to the 105.00 inflection point if not the 105.30 previous high.
If you see DXY breaking below the channel, though, then you should also be ready to trade a breakdown that could take the dollar to the 104.35 or 104.00 previous areas of interest.

Cardano (ADA/USD) 1-hour Chart by TradingView
After a strong two weeks in January, Cardano (ADA/USD) took a chill pill and is now locked in a range between the .3600 support and .4100 resistance zones.
Range playas who are looking for crypto trades can take advantage of ADA/USD trading near an unbroken range support.
ADA buyers can buy at current levels or wait for a breakout above the 100 SMA and current consolidation before aiming for inflection points like the .3800 mid-range area.
Think the range will soon lead to a downside breakout?
If you’d rather sell ADA/USD, then you can also make trading plans around break-and-retest or reversal plays in the event of a breakout.
Good luck and good trading this one!


Comments are closed.