Crypto Watchlist: Bitcoin’s (BTC/USD) Short-Term Range Support
Is the $25K handle too much for Bitcoin (BTC/USD) bulls?
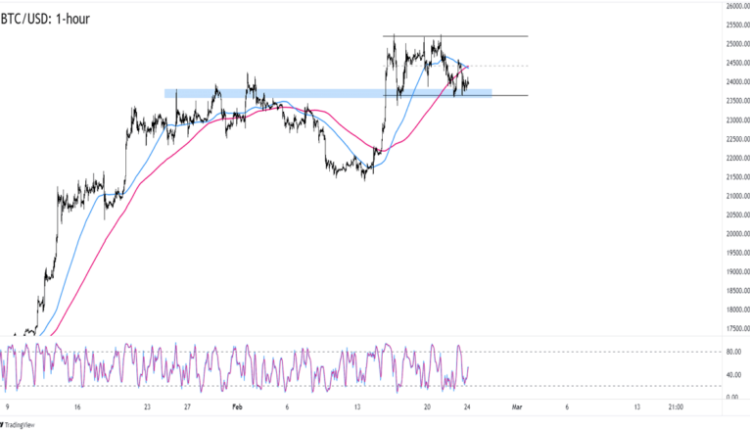
In case you missed it, BTC/USD has been struggling to surpass its $25,250 intraweek highs as traders continue to price in higher interest rates from the Fed and maybe slower-than-expected global growth this year.

Bitcoin (BTCUSD) 1-Hour Chart by TradingView
BTC/USD is now trading closer to the $24,000 mark that served as support last week AND was a big resistance level back in late January/ early February.
Can Bitcoin maintain its range?
Moving averages are favoring more selling as the 100 SMA just crossed below the 200 SMA.
If you squish your 1-hour charts, you’ll see that the last three SMA crossovers led to days-long directional moves for BTC/USD.
More BTC selling can drag BTC/USD from its current levels to the $23,600 or $23,350 previous inflection points.
Don’t discount further buying though! U.S. equities managed to recover some of its intraweek losses even when the latest U.S. GDP and weekly unemployment claims reports supported further rate hikes from the Fed.
If risk-taking becomes the name of the (crypto) game in the next trading sessions, then BTC/USD could jump to the $24,450 mid-range levels.
Whichever bias you end up trading, make sure to practice your best risk management moves so you get to trade for another day!
This content is strictly for informational purposes only and does not constitute as investment advice. Trading any financial market involves risk. Please read our Risk Disclosure to make sure you understand the risks involved.


Comments are closed.