7 Weeks of Losses, Momentum Shows Few Signs of Slowing
Natural Gas, 7th Week of Losses, Another Doji Emerges – Technical Update:
- Natural gas prices fell for a 7th consecutive week after dropping 15.41%
- Prices are following the implied target of a bearish Head and Shoulders
- Another Doji emerged on the daily chart, watch if there is follow-through
Trade Smarter – Sign up for the DailyFX Newsletter
Receive timely and compelling market commentary from the DailyFX team
Subscribe to Newsletter
Weekly Chart – Prices Plunge for a 7th Week
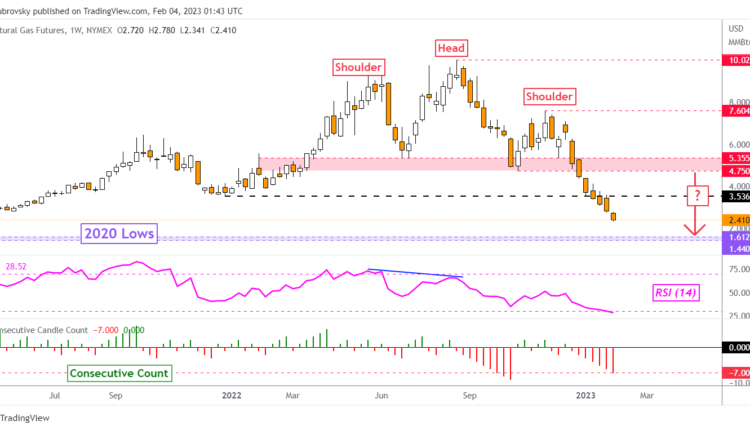
Natural gas prices are down 46.15% since the beginning of this year. If losses hold throughout February, the heating commodity will be looking at its worst 2-month performance since 2001! This past week alone was the 7th consecutive decline, marking the longest losing streak since the beginning of October. Natural gas fell 15.41% last week amid a milder United States weather upgrade.
Looking at the chart below, prices are continuing lower in the direction of the bearish Head & Shoulders implied target. If natural gas follows the outlook of the chart formation, we could see prices reach lows from 2020. That makes for a range of support between 1.44 and 1.61. Let us take a closer look at the daily chart to see what are key levels to watch in the week ahead.
Chart Created Using TradingView
Daily Chart – Another Doji Emerges
Another Doji candlestick pattern made itself present after prices closed on Friday. This is not the first time we have seen a Doji in a while. In fact, something like the latter has appeared on numerous occasions throughout the most recent downtrend since December. The Doji is a sign of indecision, not necessarily a reversal warning.
What matters is after the Doji. Upside follow-through could be an increasing sign of a turn higher. At this time, momentum is favoring the downside given a lack of RSI divergence. Prices now face immediate support which is the 100% Fibonacci extension level at 2.326. A confirmatory breakout under this price exposes the 114.6% level at 1.555.
In the event of a turn higher, keep a close eye on the 20-day Simple Moving Average (SMA). The latter is helping maintain the near-term downside focus. It may hold as resistance, pivoting natural gas back lower. Otherwise, extending gains would place the focus on the December 2021 low at 3.536. The latter may establish itself as new resistance.
Recommended by Daniel Dubrovsky
The Fundamentals of Breakout Trading

Chart Created Using TradingView
— Written by Daniel Dubrovsky, Senior Strategist for DailyFX.com
To contact Daniel, follow him on Twitter:@ddubrovskyFX


Comments are closed.