XAU/USD Resilience Holds at Nine-Month High
Gold (XAU/USD) Weekly Technical Outlook: Neutral
- Gold prices bullish above $1,930, bearish below $1,900.
- XAU/USD peaks at nine-month high as the RSI (relative strength index) rises into overbought territory.
- USD strength and slowing momentum could place pressure on the upside move.
Recommended by Tammy Da Costa
Get Your Free Gold Forecast
Gold prices endure after bullish recovery drives XAU/USD to a nine-month high
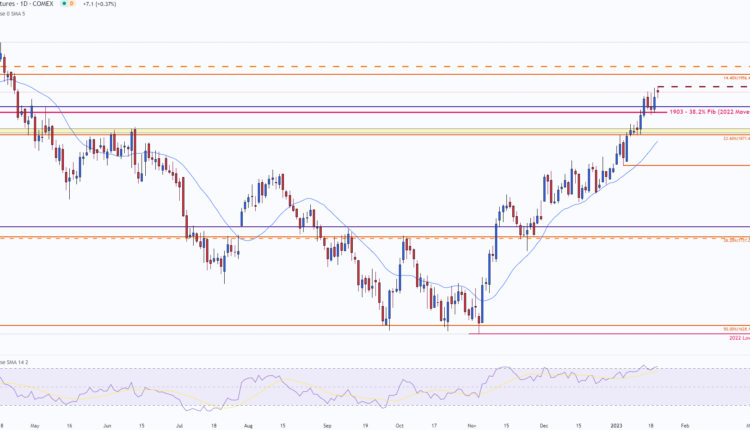
Gold prices ended the week marginally higher after a slight uptick in the Dollar limited gains above $1,930. Although a break of the $1,900 psychological level assisted in driving XAU/USD to a nine-month high of $1,939 in Friday’s session, technical indicators suggest that bullish momentum could be losing steam.
With prices falling back into a narrow range of support and resistance, the formation of a doji candle on the daily chart could be suggestive of indecision. While buyers aim to regain confidence above $1,930, sellers are determined to drive prices lower.
Recommended by Tammy Da Costa
The Fundamentals of Range Trading
Gold (XAU/USD) Daily Chart
Chart prepared by Tammy Da Costa using TradingView
As the rising trendline from the October low remains intact, the 38.2% Fibonacci retracement of the 2022 move has formed an additional barrier of support around $1,903. With gold prices recovering over 19% of last year’s losses, the three-month rally has driven the daily RSI (relative strength index) into overbought territory.
From the perspective of the weekly chart, a longer lower wick on the current candle represents a strong retaliation from sellers. After falling to a weekly low of $1,898.6, the quick reaction from and a move above $1,900 helped limit further declines.
Gold (XAU/USD) Weekly Chart

Chart prepared by Tammy Da Costa using TradingView
While Fibonacci levels of the 2018 – 2020 move provides longer-term support and resistance between $1,871 (the 23.6%) and $1,956 (14.4%), a clear break of $1,939 could assist in driving higher prices.
Recommended by Tammy Da Costa
How to Trade Gold
— Written by Tammy Da Costa, Analyst for DailyFX.com
Contact and follow Tammy on Twitter: @Tams707


Comments are closed.